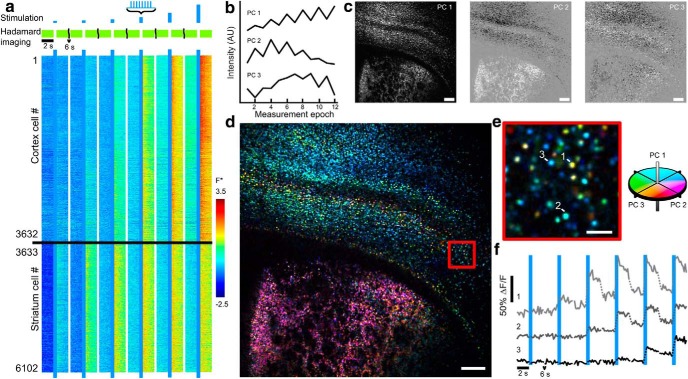
Figure 7.
Ultra-wide-field AON in acute brain slices. a, Top, Stimulation and imaging protocol. An FOV spanning cortex and striatum was stimulated with eight 5 ms pulses of 488 nm light at 20 Hz with intensities of 15, 30, 60, 120, 240, and 480 mW/cm2. Bottom, Heat map of 6102 single-cell fluorescence traces acquired simultaneously. Individual fluorescence intensities traces were normalized as F* = [F − mean(F)]/SD(F). White breaks separate measurements at different optogenetic stimulus intensities. Imaging was performed at 5.6 Hz with 100 mW/cm2 561 nm light. b. Waveforms of main principal components from n = 31,754 cells. See Materials and Methods for additional details. c, Principal components from a projected into pixel space. d, Image of the slice recorded in a with cells colored by the principal component amplitudes of the functional responses. e, Close-up of the red boxed region of d. f, Three example single-cell fluorescence traces. Dotted lines indicate pauses in Hadamard imaging (400 ms during optogenetic stimulation, 6 s between stimuli). ΔF/F is defined relative to the intensity in the first imaging epoch. Scale bars: c, d, 250 μm; e, 50 μm.

