Figure 8.
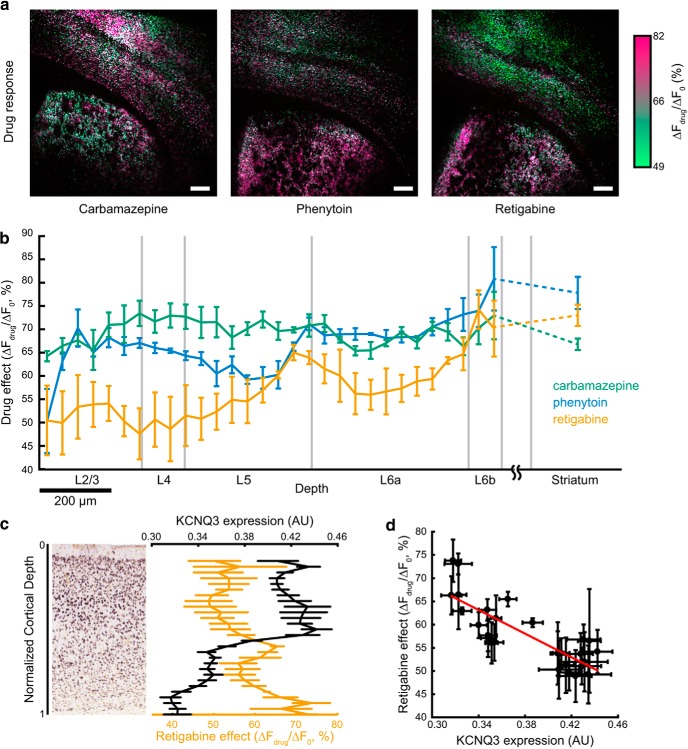
Mapping effects of AEDs on excitability. a, Maps of AED effects on excitability. Slices were measured using the excitability protocol as in Figure 7. The protocol was repeated five times before drug addition and four times after addition of carbamazepine (100 μm), phenytoin (100 μm), or retigabine (25 μm). The ratio of mean optogenetically induced change in fluorescence for each cell before (ΔF0) and after drug addition (ΔFdrug) is encoded as color in a green to pink axis. Scale bars, 250 μm. b, Average drug response (ΔFdrug/ΔF0) as a function of cortical depth for n = 3 slices for each drug. All striatal cells in a slice were pooled into a single bin. Data represent n = 9,793 cells for carbamazepine, 11,858 cells for phenytoin, and 10,103 cells for retigabine. Error bars represent SEM over n = 3 slices for each drug. c, Left, In situ hybridization image from Allen Brain Atlas experiment 100041071 showing KCNQ3 expression in somatosensory cortex of a P28 mouse. Right, Cortical depth dependence of retigabine drug effect (same as Fig. 4b) and KCNQ3 expression level determined from in situ hybridization images of n = 11 slices from the Allen Brain Atlas. d, Data from c showing effect of retigabine on excitability versus KCNQ3 expression. Best fit line is indicated in red. Error bars indicate SEM, treating each slice as an independent measurement.

