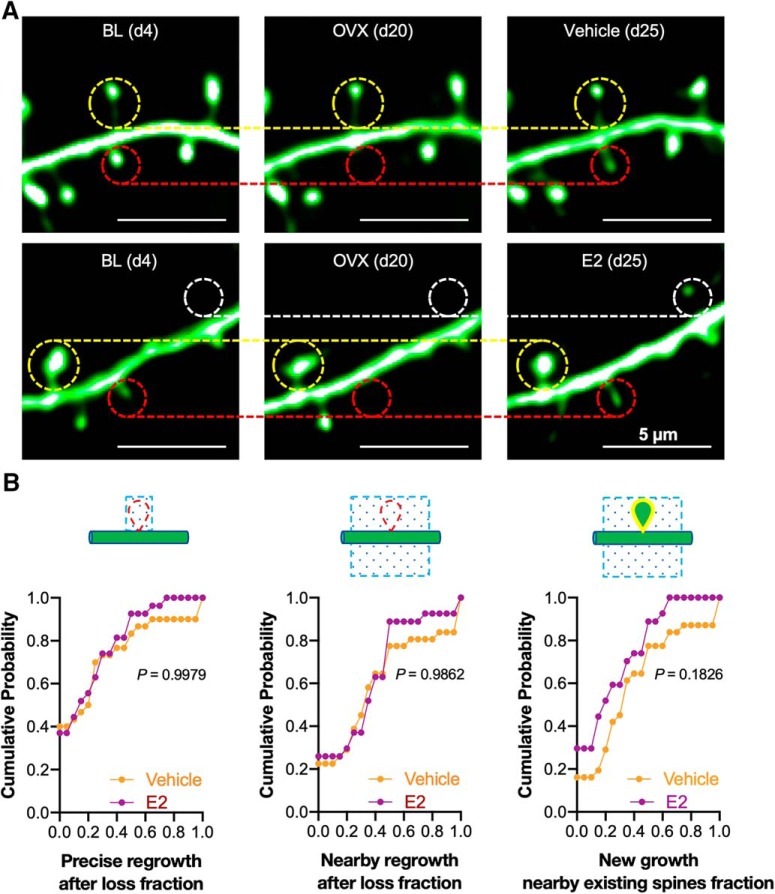
Figure 10.
The spines that appear following post-OVX estradiol treatment are no more likely to be located at or nearby sites of previous spine loss or nearby existing spines than those that appear following vehicle treatment. A, Representative images showing spine dynamics before OVX (BL; d4), after OVX (d20) and after vehicle or E2 treatment (d25). The regrowth of lost spines was analyzed (red circles) with adjacent persistent spines (yellow circles) and new spines (white circles), with the persistent spines used as fiduciary points in all segments with OVX-induced spine loss and E2 treatment-induced spine gain. B, Cumulative probability curves summarized the spine regrowth rate following vehicle (30 dendritic segments from 4 mice) and E2 (27 dendritic segments from 4 mice) treatments. Left, Spine regrowth at the precise location where a spine was previously lost. Center, Spine regrowth nearby where a spine was previously lost. Right, Spine regrowth nearby existing spines (p > 0.10 for all three comparisons by the Kolmogorov–Smirnov two-sample test).

