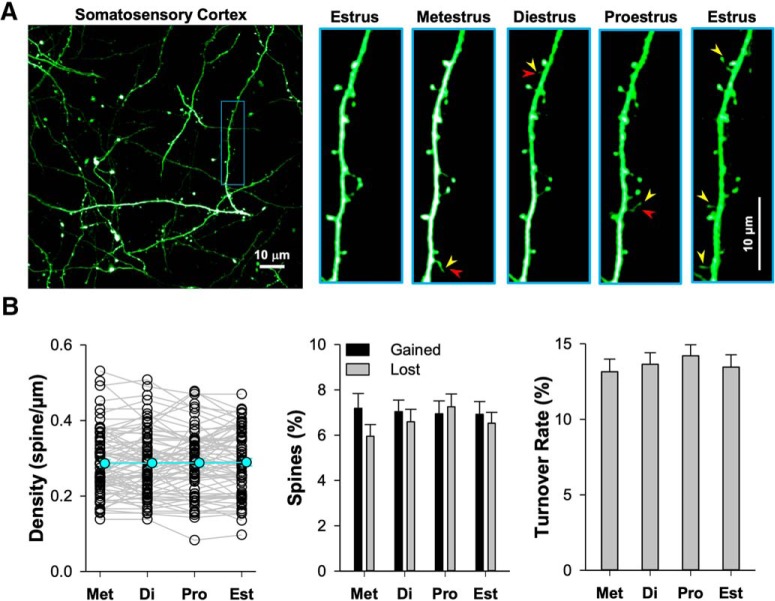
Figure 7.
Stable spine density and dynamics across the estrous cycle in somatosensory cortex. A, Representative time-lapse images showing a segment of apical dendrite from layer 5 pyramidal neurons in somatosensory cortex. The yellow arrowheads mark the added spine examples, the red ones for lost, and the blue ones marks persistent spines. B, The scatter plot shows the spine density changes across the estrous cycle (75 dendritic segments from 5 mice; p = 0.946, F = 0.123). The bar graphs summarize gained (p = 0.982, F = 0.058) and lost rate (p = 0.287, F = 1.266) as well as TOR (p = 0.522, F = 0.752) of spines, calculated by comparing to the previous time point. The repeated-measures one-way ANOVA test was used for comparison among all five estrus stages (df = 299). The p > 0.05 was defined as nonsignificant.

