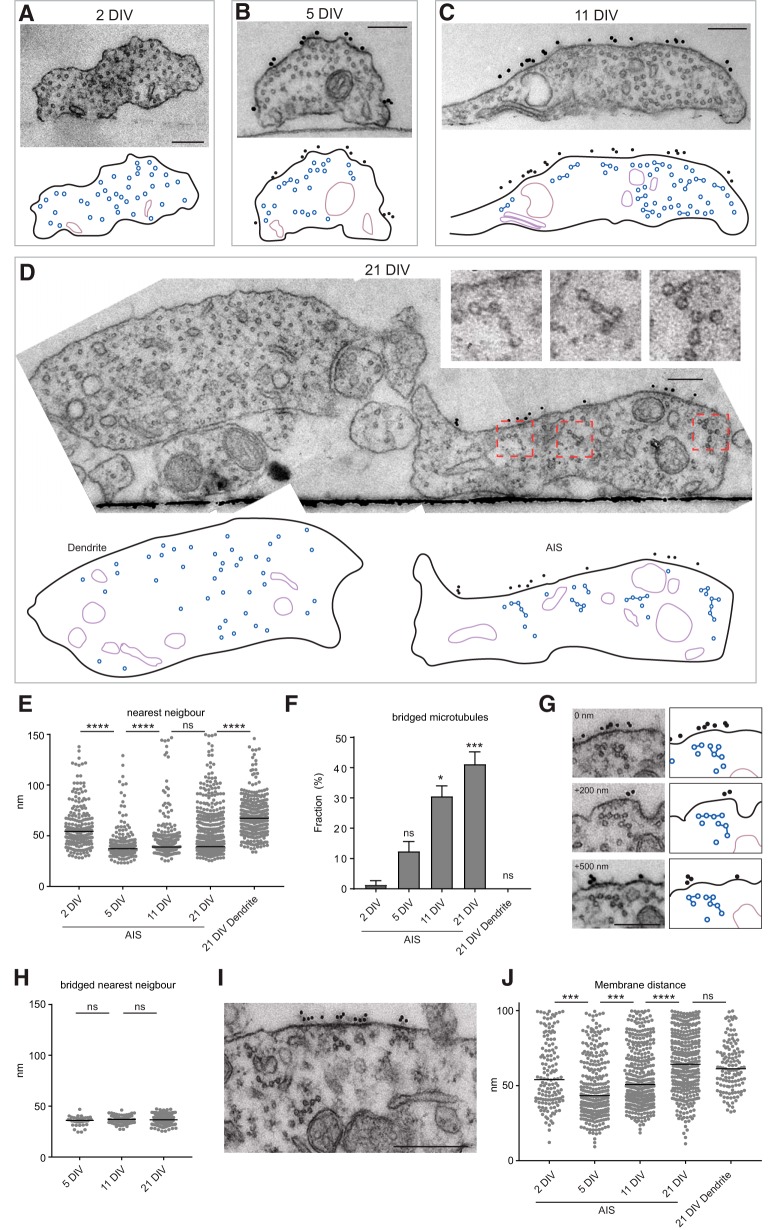
Figure 3.
Microtubule fasciculation during AIS maturation. A–D, Typical examples of AIS microtubule organization in 2 DIV (A), 5 DIV (B), 11 DIV (C), and 21 DIV (D) neurons. In the schematic representation below, microtubules and cross-bridges are in blue and the organelles in violet. For 2 DIV we transfected neurons at 0 DIV with Ankyrin-G-GFP and identified the AIS based on the GFP accumulation in one of the neurites because neurofascin is largely absent at that stage, hence there is no gold labeling. Scale bar, 200 nm. E, Nearest-neighbor analysis of inter-microtubule distances during neuron development, measured from mid-microtubule. The graph represents all microtubules within 150 nm range, leaving out a few distant single microtubules, however all microtubules were included for the statistics. The black lines represent the median values. Statistics, Kruskal–Wallis test with Dunn's correction. F, Quantification of bridged microtubules during neuron development. Each neuron was imaged at multiple positions along the AIS or dendrite, and the average of bridged microtubules was quantified per image. Error bar represent SEM and for the statistics a one-way ANOVA with Dunn's correction was performed and compared with 2 DIV. G, Serial sections of fasciculated microtubules showing that the cross-bridges do not form a continuous structure (distance in between images is indicated). Scale bar, 200 nm. H, Nearest-neighbor analysis for cross-bridged microtubules at the AIS during development. The black lines represent the median values. Statistics, Kruskal–Wallis test with Dunn's correction. I, Zoom of the plasma membrane of a 21 DIV neuron AIS showing the close apposition of fasciculated microtubules with the dense undercoating of the membrane and gold labeled neurofascin. Scale bar, 200 nm. J, Quantification of the microtubule distance to the plasma membrane in the AIS during development. Only microtubules in close proximity to the plasma membrane (100 nm) are represented here and are measured from the middle of the microtubule. The black lines represent the median values. Statistics, Kruskal–Wallis test with Dunn's correction. Number of neurons (N) and total number of quantified sections (n) analyzed for E–G: 2 DIV: N = 3, n = 7; 5 DIV: N = 2, n = 8; 11 DIV: N = 3 (of which one 10 DIV), n = 11; 21 DIV: N = 5, n = 17. ns, Nonsignificant; *p < 0.05, ***p < 0.005, ****p < 0,0001.

