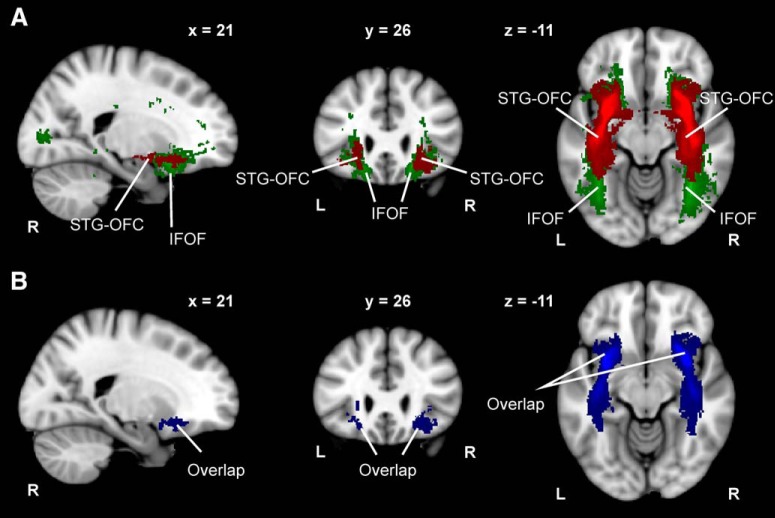
Figure 4.
STG–OFC tract and IFOF comparison. A, Composite STG–OFC tract and IFOF computed by averaging the connectivity distributions of 38 subjects. B, Overlap between the STG–OFC tract and IFOF computed as the intersection between the connectivity distributions of 38 subjects. Neurological convention is used with MNI coordinates at the top of each slice. L, Left; R, right.

