Figure 1.
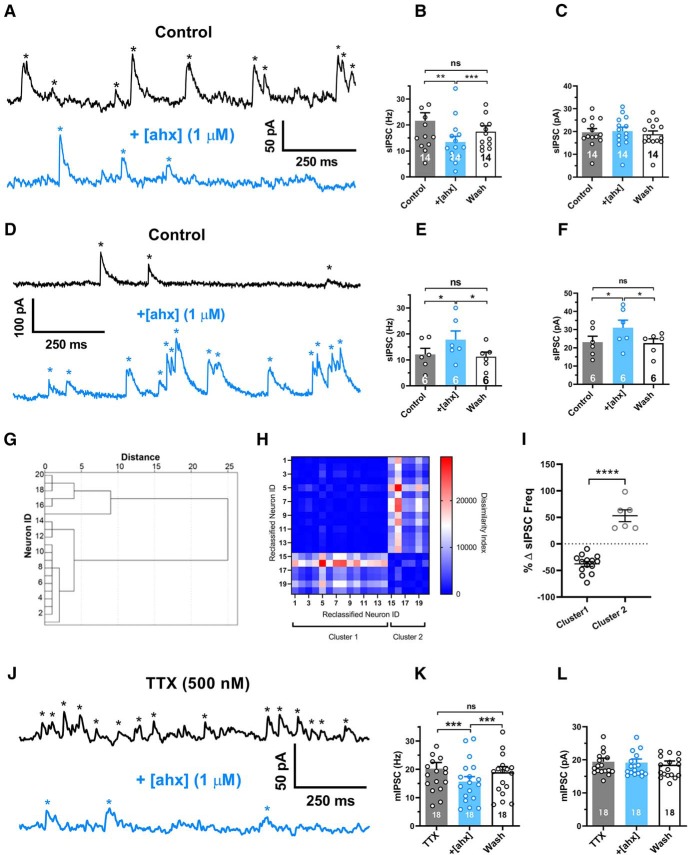
[ahx5–24]NPY reduces the frequency of BLA principal neuron miniature inhibitory synaptic events. A, Voltage-clamp recordings (Vh = −15 mV, Cs+-methanesulfonate internal solution) from a representative PN, which responded to bath-applied [ahx5–24]NPY (1 μm; blue) with a substantial (>10%) reduction in the sIPSC frequency (black). sIPSCs, seen as upward current deflections (asterisks), occurred frequently (∼20 Hz) under control conditions (blue). Following bath application of the Y2R agonist to the same PN, the sIPSC frequency was substantially reduced (peak drug effect ∼5 min wash). B, Mean sIPSC frequencies from the subset of PNs in which the Y2R agonist decreased spontaneous event frequencies (>10%; 14 of 20 tested). sIPSC frequencies in control, during peak effect of [ahx5–24]NPY (1 μm), and after prolonged washout (p = 0.0027; n = 14 cells, 10 rats; one-way repeated-measures ANOVA; F(1.096,14.25) = 13.62, p = 0.0020). In these cells, the Y2R agonist significantly and reversibly reduced the mean sIPSC frequency from 21.6 ± 3.1 to 13.4 ± 2.2 Hz (Bonferroni's post-test). C, Mean amplitudes of sIPSC events reported in B. The Y2R agonist did not significantly affect sIPSC amplitude in these PNs (control, 19.7 ± 1.6 pA; [ahx5–24]NPY, 20.2 ± 1.8 pA; one-way repeated-measures ANOVA; F(1.437,18.68) = 3.566, p = 0.0616; n = 14 cells, 10 rats). D, Voltage-clamp recordings as in A from a representative PN, which responded to [ahx5–24]NPY (1 μm) with a substantial (>10%) increase in mean sIPSC frequency (blue). The Y2R agonist increased the frequency of large-amplitude events that typically clustered into clear bursts. E, Mean sIPSC frequencies from the subset of PNs where the Y2R agonist increased spontaneous event frequencies (>10% of control values; 6 of 20 tested) in control, during peak effects of [ahx5–24]NPY (1 μm), and after prolonged washout (one-way repeated-measures ANOVA; F(1.401,7.006) = 12.06, p = 0.0076; n = 6 cells, 6 rats). In these PNs, the Y2R agonist significantly and reversibly increased mean sIPSC frequency from 12.1 ± 2.3 to 17.8 ± 3.3 Hz (Bonferroni's post-test). F, Mean sIPSC amplitudes from the events reported in E (one-way repeated-measures ANOVA; F(1.540,7.699) = 10.72, p = 0.0078; n = 6 cells, 6 rats). In these PNs, the Y2R agonist significantly and reversibly increased sIPSC amplitude from 23.1 ± 3.3 to 31.0 ± 4.2 pA (Bonferroni's post-test). G, Dendrogram of a hierarchical cluster analysis performed on Δ sIPSC frequency of PNs following application of [ahx5–24]NPY (1 μm). H, Proximity matrix of a hierarchical cluster analysis using squared Euclidean distance on Δ sIPSC frequency of PNs following application of [ahx5–24]NPY (1 μm). Neurons were reclassified based on similarity for graphical representation. I, Scatter plot depicting the heterogeneous response profile of sIPSC frequency of PNs following application of [ahx5–24]NPY (1 μm). Responses fall robustly into two distinct clusters (t = 9.116, df = 18, p < 0.0001). J, Voltage-clamp recordings as in A from a representative PN in the presence of TTX (500 nm). mIPSC frequencies (black) remained comparable to event frequencies observed without TTX (∼20 Hz) under control conditions (blue). Application of [ahx5–24]NPY (1 μm) substantially reduced mIPSC frequency in this cell. K, Mean mIPSC frequency in control, with [ahx5–24]NPY (1 μm) and after washout (one-way repeated-measures ANOVA; treatment: F(1.559,26.50) = 28.18, p < 0.0001; n = 18 cells, 14 rats). In all PNs tested (18 of 18), the Y2R agonist significantly reduced the mIPSC frequency from 20.2 ± 2.1 to 15.6 ± 1.7 Hz (Bonferroni's post-test). L, Mean mIPSC amplitudes from the events in H. The Y2R agonist did not significantly affect mIPSC amplitudes (control, 19.4 ± 1.1 pA; [ahx5–24]NPY, 19.1 ± 1.1 pA; one-way repeated-measures ANOVA; treatment: F(1.338,22.75) = 2.818, p = 0.0975 n = 18 cells, 14 rats). *p < 0.05, **p < 0.01, ***p < 0.001, ****p < 0.0001, ns, not significant.

