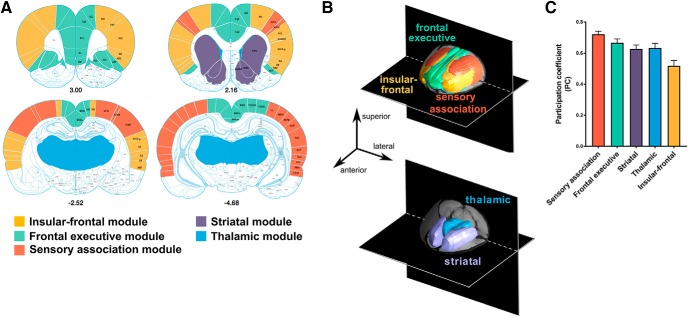
Figure 2.
A, Brain regions (N = 118) selected as input nodes in the modularity analysis color coded according to their subsequent modular affiliation (shown in B) and represented as an underlay on a stereotaxic brain atlas (distance from bregma in millimeters is given below each slice). B, Results from the modularity analysis demonstrating the five functional networks identified and illustrated in 3D color-coded composite images. C, Mean PC of each module.

