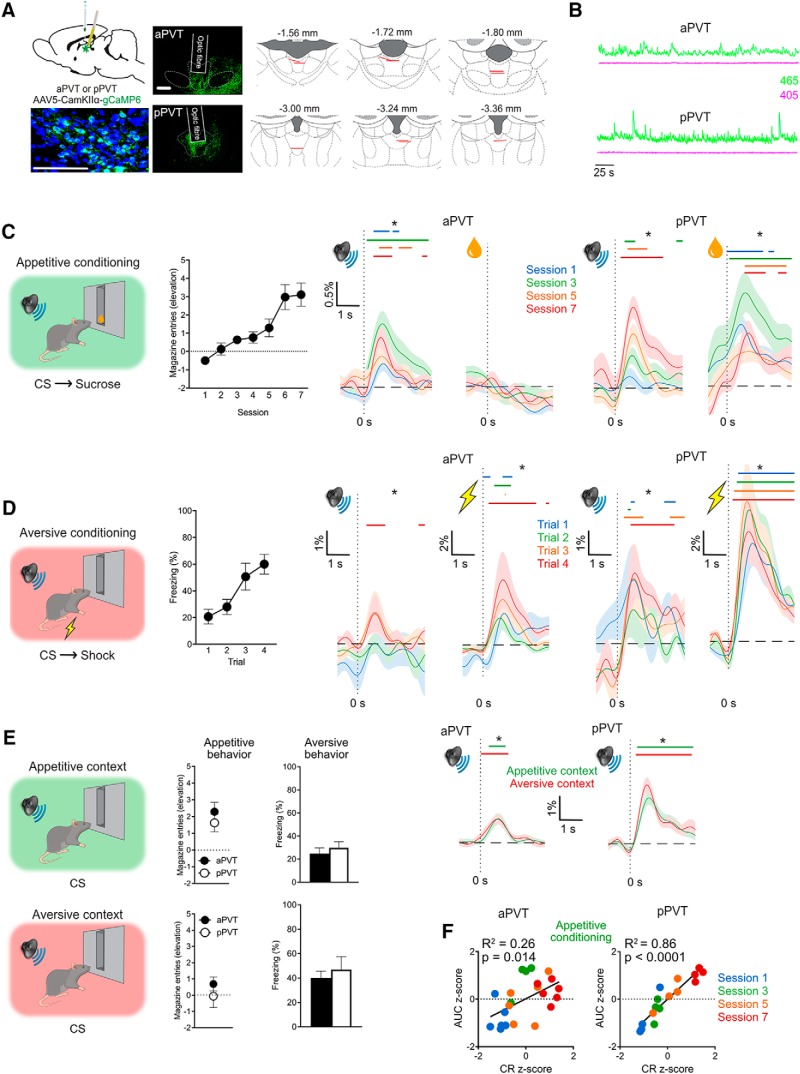
Figure 1.
Experiment 1. A, AAV was used to express GCaMP6 in aPVT or pPVT in separate animals and fiber optic cannulae implanted into these regions. Representative images show native GCaMP expression and DAPI staining in PVT (green, native GCaMP; blue, DAPI; scale bar, 100 μm), native GCaMP expression for aPVT and pPVT (scale bar, 500 μm), as well as location of fiber tips for all animals included in the analyses. B, Representative demodulated photometry traces from aPVT (during appetitive training) and pPVT (during aversive training). C, Rats received Pavlovian appetitive conditioning and acquired magazine entries during the CS. Photometry traces show mean ± SEM %ΔF/F across trials for the 1 s prior and 3 s after CS and appetitive US presentations. D, Rats received Pavlovian aversive conditioning and acquired fear responses to the CS. Photometry traces show mean ± SEM %ΔF/F across trials for the 1 s prior and 3 s after CS and aversive US presentations. E, Rats were tested for appetitive and aversive behaviors in their respective training contexts. There was robust expression of appetitive and aversive behaviors. Photometry traces show mean ± SEM %ΔF/F across trials for the 1 s prior and 3 s after CS presentations in each context. In each panel, a significant increase in %ΔF/F was determined whenever the lower bound of the 99% CI was >0. These points of statistical significance are shown as colored lines above each %ΔF/F curve with different colors corresponding to the respective traces from sessions (C) or trials (D). aPVT, n = 6; pPVT, n = 4. F, Scatterplots of subject-normalized CS-elicited PVT activity (AUC 0.5–1.5 s from CS onset) and associated conditioned responding across initial appetitive conditioning sessions. *Indicates lower bound 99% CI > 0%ΔF/F (colored lines above traces). aPVT, n = 6; pPVT, n = 4.

