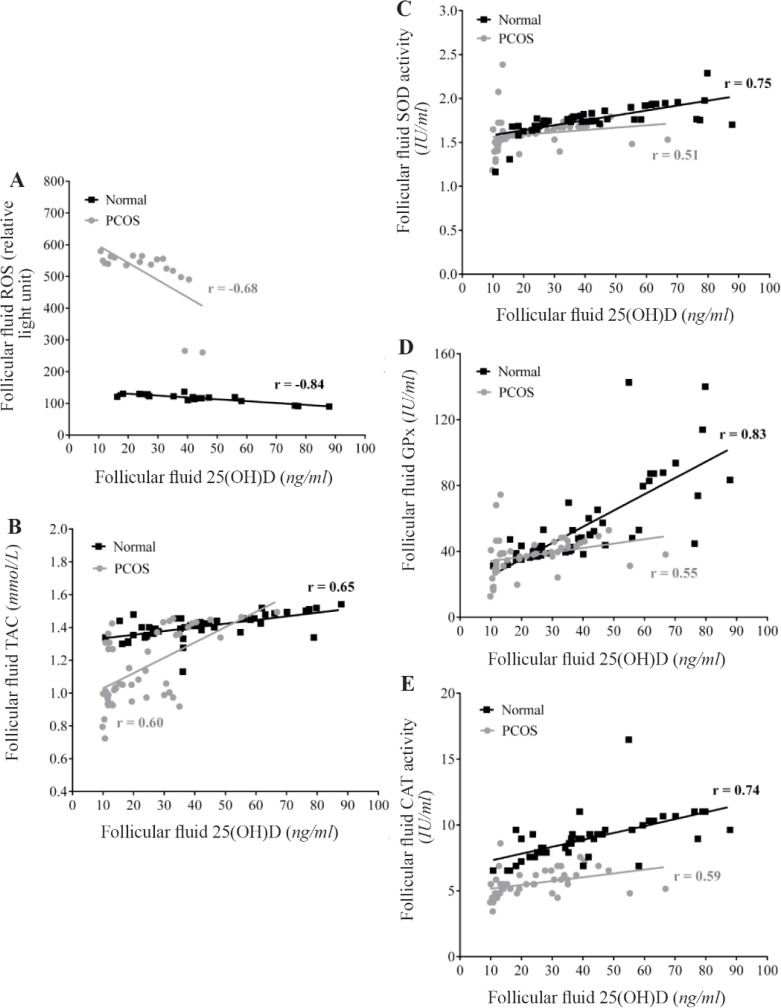
Figure 2.
Correlation between follicular fluid levels of 25(OH)D with ROS (A), TAC (B), SOD (C), GPx (D) and CAT (E) in the control (n=50) and PCOS (n=50) groups. There were significant positive correlations between FF levels of 25(OH)D with TAC and activities of SOD, GPx, and CAT, while a significant negative correlation was found between FF levels of 25(OH)D with ROS amounts in the two studied groups. r= Pearson correlation coefficient (p<0.001)

