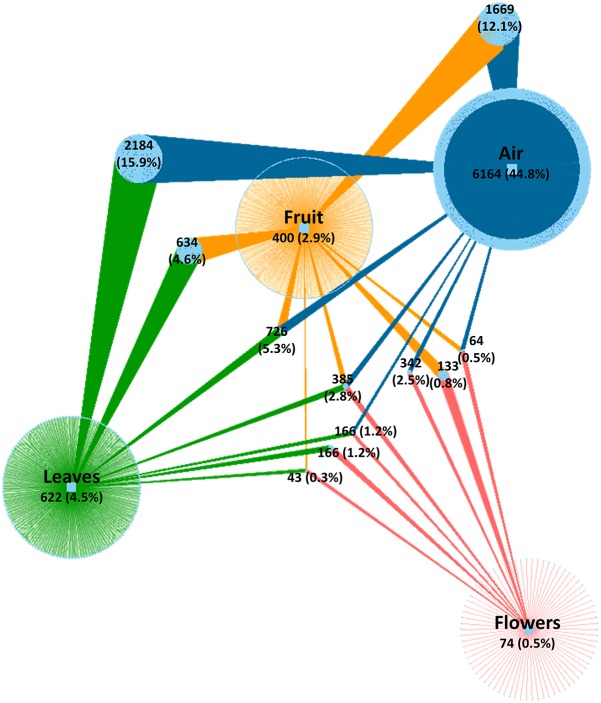
FIGURE 1.
Network of shared and unique fungal OTUs among investigated samples. Colored edges (links) represent OTUs associated to sample types (air, fruit, leaves, and flowers). Light blue circle nodes connecting two or more samples represent shared OTUs. Numerical values indicate the number of OTUs and their percentage relative to the total number of OTUs.

