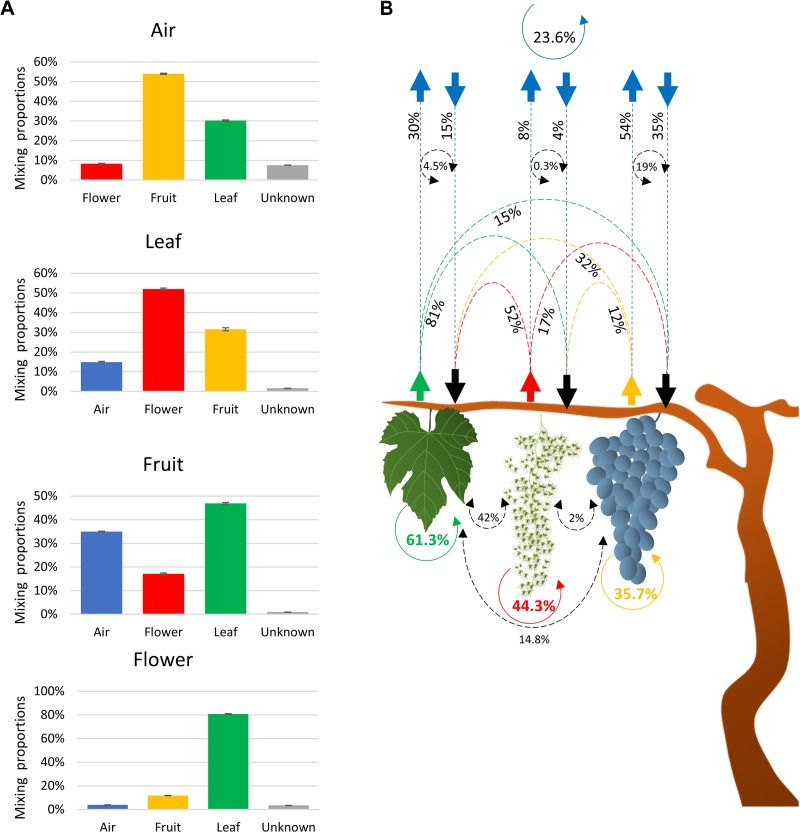
FIGURE 2.
Charts showing fractions of the estimated sources of fungal communities in each sink environment (air, leaves, and flowers/fruit) (A) and schematic description of the estimated source of the fungal communities associated with air and plant organs (B). The scheme shows the estimated movement of communities originated from leaves (green dashed arrows), flower (red dashed arrows), fruit (orange dashed arrows), and air (blue arrows). Dashed black circle arrows indicate the percentages of community commonly exchanged between two environments. Solid colored circle arrows showed the percentages of community that retune to the same environment from all the other sources (B).

