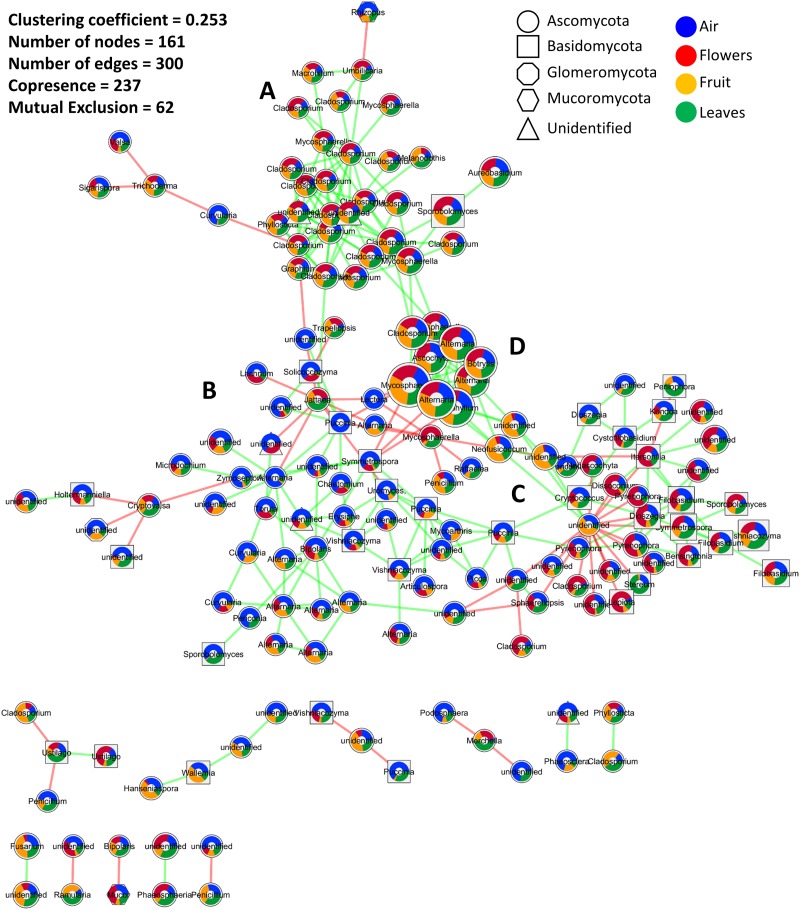
FIGURE 3.
Microbial association network showing interactions (co-occurrence and mutual exclusion) represented by green and red links, respectively. The size of the nods indicates the average relative abundance of OTUs across all investigated samples, while colored pie charts embedded inside the nodes show the relative distribution of each OTU in different samples (air, flowers, fruit, and leaves). Node shapes are used to differentiate fungal phyla. (A–D) are used to indicate the four sub-clusters that appeared to be influenced by the average relative abundance distribution of the interacting OTUs in the investigated samples. Interactions were calculated by CoNet, clustered using Connected Components algorithm as implemented in clusterMaker2, and visualized in Cytoscape 3.6.

