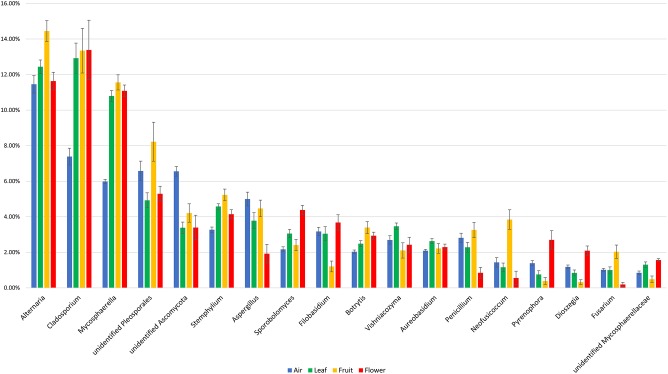
FIGURE 4.
Fungal taxa with significant temporal variations and a relative abundance of at least taxa 1% in different investigated samples (air, fruit, flowers, and leaves). The statistical comparison was done using a non-parametric Kruskal–Wallis test, and the p values were calculated through 1000 permutation and corrected using FDR method (Supplementary Table S2).

