
Figure 3.
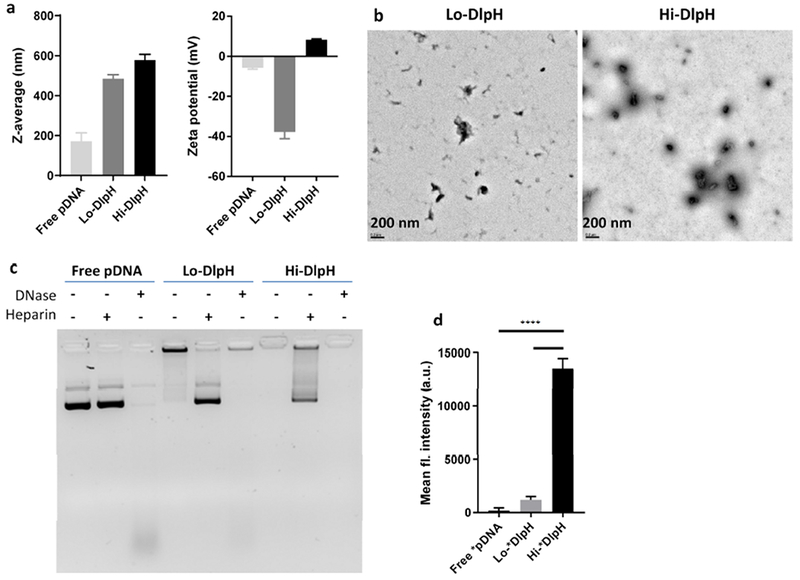
Characteristics of DlpH ternary complex. (a) Z-averages and zeta potentials of free pDNA, Lo-DlpH and Hi-DlpH. (b) TEM images of Lo-DlpH and Hi-DlpH. Scale bar: 200 nm. (c) Agarose gel electrophoresis of free pDNA, Lo-DlpH and Hi-DlpH incubated in DNase or heparin. (d) Cellular uptake of free pDNA, Lo-DlpH and Hi-DlpH by Huh7 cells. Data are expressed as means and standard deviations of three repeated tests of a representative batch of DlpH. ****: p<0.0001 by the Tukey’s multiple comparisons test.