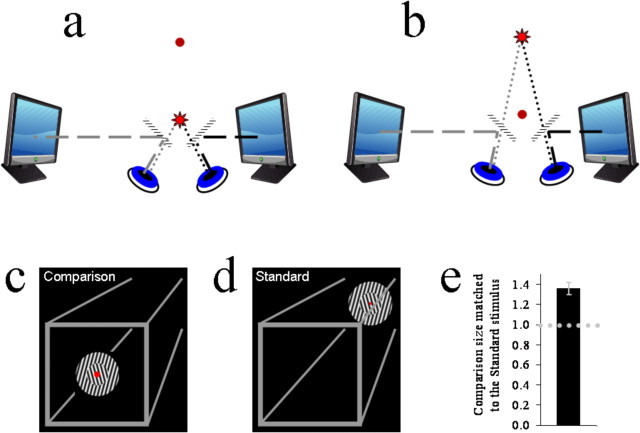
Figure 1.
a, b, Graphics depicting the apparatus used in these experiments. c, d, Graphics depicting the three-dimensional visual frame used in all experiments, and the subjective appearance of the standard and comparison stimuli in experiment 1. e, Bar plot showing the comparison stimulus size matched to the standard stimulus as a proportion of the standard stimulus size. The dotted horizontal line shows a proportion of 1, at which there would be no size illusion. The error bar shows SEM.

