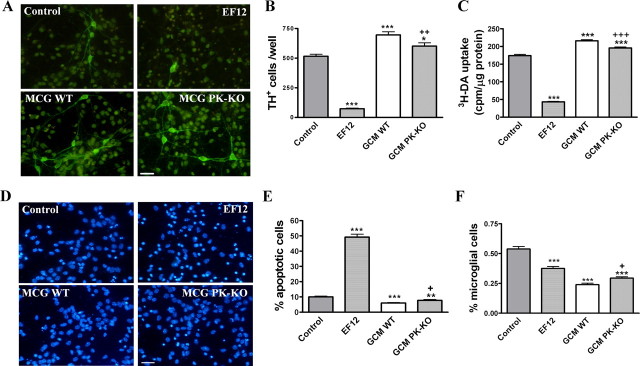
Figure 10.
Effects of WT and PK-KO GCM on neuronal-enriched mesencephalic cultures from WT mice. WT neuronal-enriched midbrain cultures were treated after 6 DIV with GCM (from WT or PK-KO), defined medium (EF12), or maintained in B27/Neurobasal TM medium (control) for 24 h. A, Photomicrographs showing DA cells (TH+) in control, EF12, WT-GCM, and PK-KO-GCM treated cultures. Scale bar, 30 μm. B, Number of DA neurons expressed as TH+ cells per well. C, High-affinity [3H]DA uptake. D, Photomicrographs of total nuclei stained with bis-benzimide in control, EF12, WT-GCM, and PK-KO-GCM treated cultures. Scale bar, 30 μm. E, Chromatin condensed and fragmented nuclei were counted and expressed as a percentage of apoptotic cells with respect to the total cell number. F, Percentage of microglial cells present in the culture. Values are the mean ± SEM of three independent cultures with six replicates each. Statistical analysis was performed by one-way ANOVA, followed by Newman–Keuls multiple comparison test. +p < 0.05; ++p < 0.01; +++p < 0.001, PK-KO-GCM versus WT glia-conditioned medium. *p < 0.05; **p < 0.01; ***p < 0.001, GCM or EF12 versus controls cultures.

