
Figure 6.
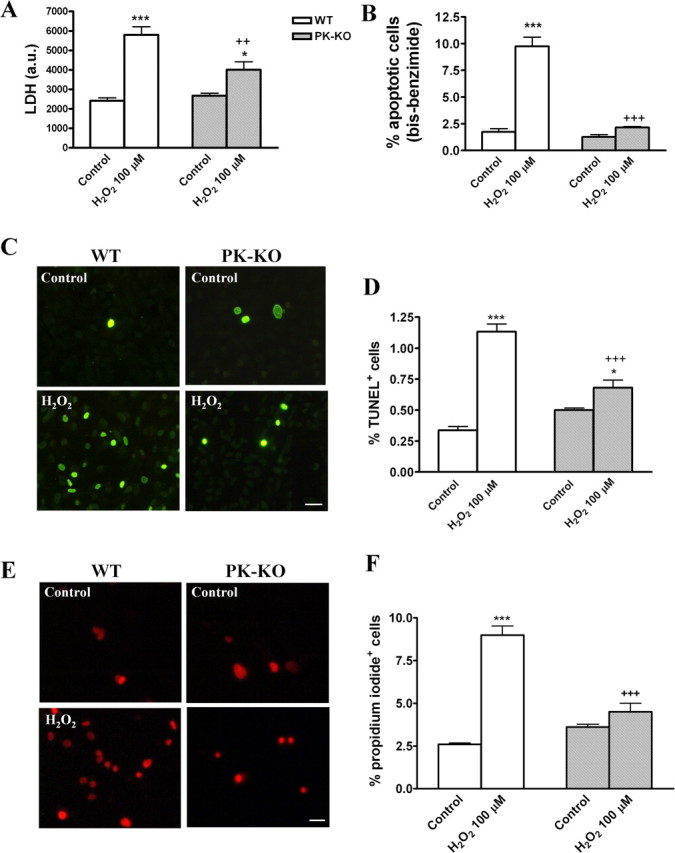
Effects of hydrogen peroxide on glial cell viability in WT and PK-KO cultures. At 6–7 d after reseeding, the cells were treated with 100 μm H2O2 for 3 h in EMEM plus d-glucose. A, LDH activity. B, Percentage of cells with the chromatin condensed or fragmented. C, Photomicrographs of TUNEL+ cells in WT and PK-KO from control and H2O2 (100 μm) treated cells. Scale bar, 30 μm. D, Percentage of TUNEL+ cells. Photomicrographs (E) and percentage of PI+ cells (F). Scale bar, 30 μm. The values express the mean ± SEM of six replicates each. Statistical analysis was performed by two-way ANOVA (the interaction between genotype and treatment was p < 0.05), followed by Bonferroni's post hoc test. ++p < 0.01; +++p < 0.001, PK-KO versus WT cultures. *p < 0.05; ***p < 0.001, H2O2 treated cultures versus controls.