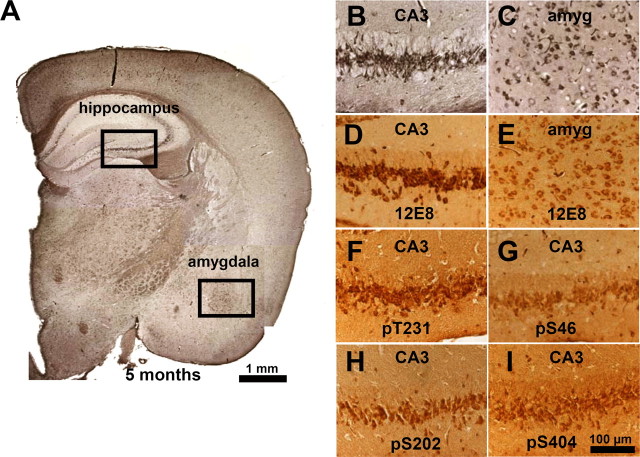
Figure 6.
Coaggregation and phosphorylation of endogenous and exogenous Tau in proaggregation mutant mice. A, Coronal section from the brain of proaggregation mice at 5 months of gene expression by Gallyas silver staining. The frames indicate NFTs in the hippocampus and amygdala of proaggregation mutant mice. B, C, Higher magnification of the hippocampus and amygdala. D, E, The same areas as B and C show positive 12E8 staining. F–I, Pyramidal neurons, CA3 region positive for pT231, pS46, pS202, and pS404. These sites lie outside the repeats and demonstrate the coaggregation of mouse Tau. Scale bars: A, 1 mm; B–I, 100 μm. amyg, Amygdala.

