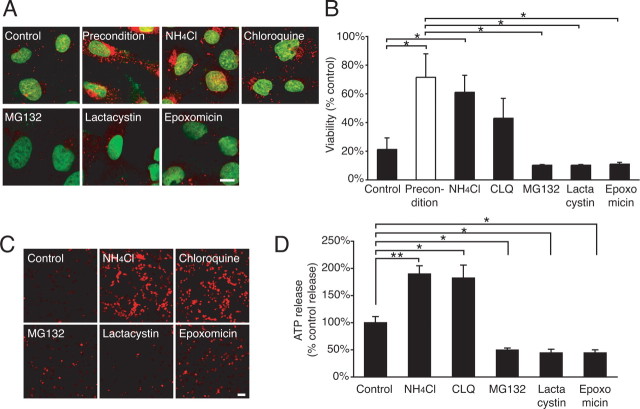
Figure 5.
Inhibitors of protein degradation induced preconditioning. A, Cx43 immunocytochemistry (red) of C6–Cx43+ cells 6 h after exposure to control vehicle (control), tamoxifen-preconditioned (precondition), or 5 h after exposure to inhibitors of lysosomes NH4Cl (10 mm) and chloroquine (100 μm) and of proteasomes MG132 (40 μm), lactacystin (10 μm), and epoxomycin (10 μm). Preconditioning and lysosomal inhibitors increased the Cx43 expression, whereas proteasome inhibitors were ineffective. Scale bar, 8 μm. B, Comparison of tamoxifen resistance after exposure to same agents as in A. Data represent average ± SE (n = 3–7). *p < 0.05, Tukey–Kramer test. C, Propidium iodide (red) uptake after similar exposure as in A. Scale bar, 100 μm. D, ATP release after similar exposure as in A. Data represent average ± SE (n = 4–9). *p < 0.05, **p < 0.01, Tukey–Kramer test.

