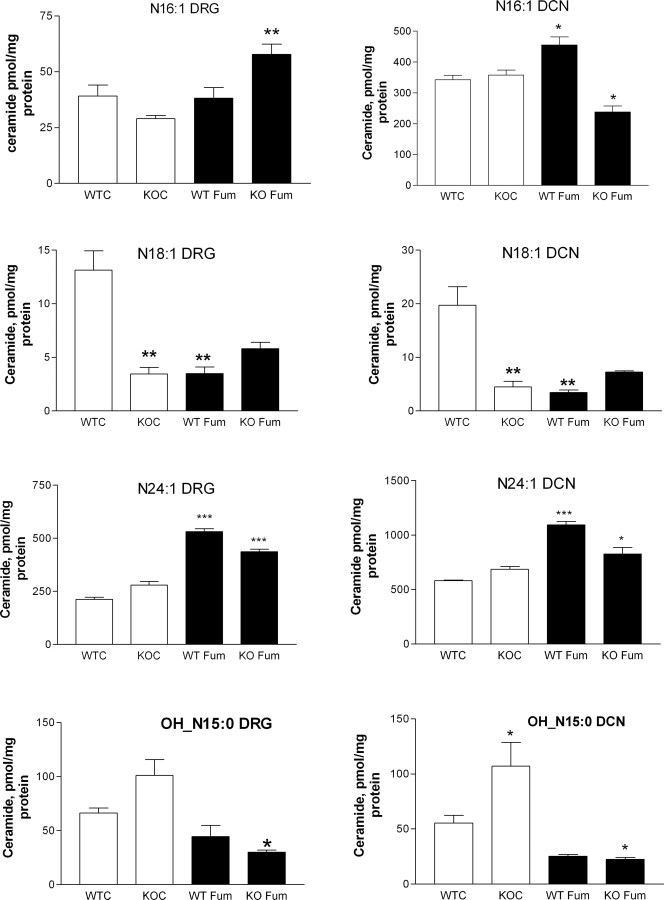
Figure 6.
Concentrations of various ceramide species in DRG (left side of each pair) and DCN (right side of each pair) in untreated and fumonisin B1-treated wild-type and apoE KO mice. The species identities are (pairs, from top to bottom) N16:1, N18:1, N24:1, and OH_N15:0. WTC are wild-type mice, KOC are apoE KO mice, WT Fum are wild-type mice treated with fumonisin B1, and KO Fum are apoE KO mice treated with fumonisin B1. The data in each graph were analyzed using ANOVA, with Bonferroni's multiple comparison tests, as follows: WTC versus KOC, WTC versus WT Fum, and KOC versus KO Fum. Significant differences are *p < 0.05, **p < 0.01, and ***p < 0.001. Thus, where KOC (open) columns are starred, this refers to comparison with the corresponding WTC (open) columns, and where fumonisin-treated (black) columns are starred, this is relative to the corresponding untreated column. The data for ceramide species examined are provided in supplemental Table 1 (available at www.jneurosci.org as supplemental material). Error bars indicate SEM.

