
Figure 4.
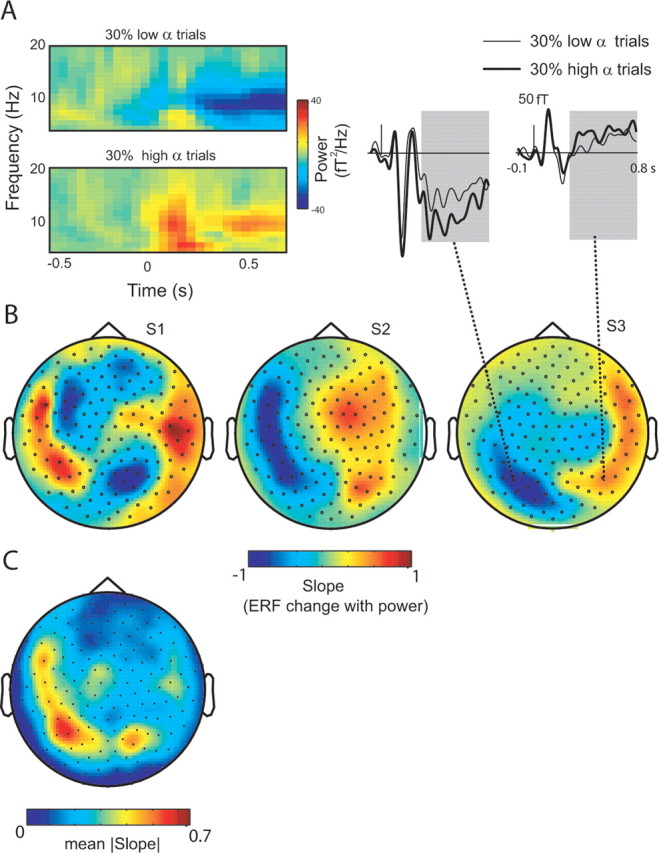
A, TFRs of the trials with the 30% lowest and 30% highest modulations of alpha power (TFRs baseline corrected; −0.6 < t < −0.1 s) in a representative subject. The respective ERFs (right) reveal a clear difference in the sustained modulation with respect to low- (thin line) and high-alpha-power changes (thick line). B, The topography of the ERF modulation with respect to poststimulus alpha power from the TFRs. The color represents the slope resulting from linear fit between ERF (0.3–0.8 s) and alpha power (0.3–0.8 s). The bipolar distributions are consistent with supplemental Fig. S1 (available at www.jneurosci.org as supplemental material). C, The grand average of absolute ERF modulations with alpha power averaged across eight subjects.