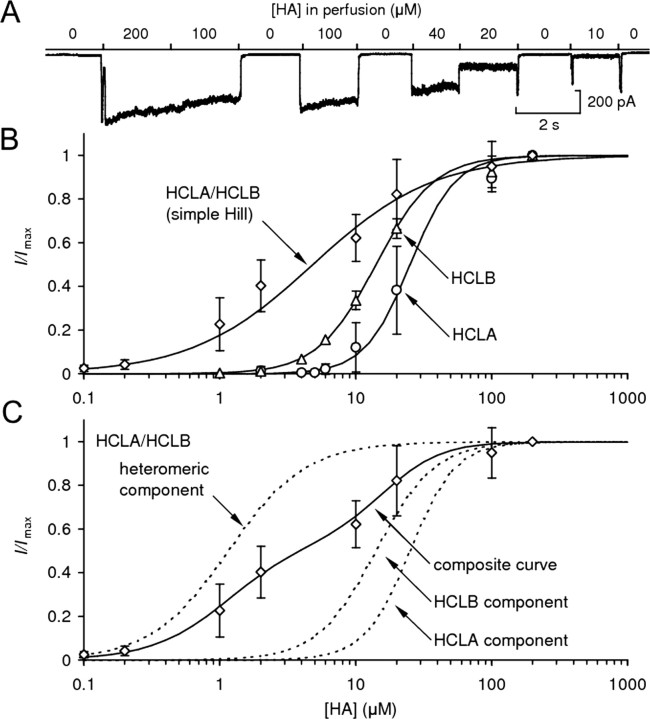
Figure 1.
Dose–response functions of HCLA and HCLB channels. A, Current recorded from an S2 cell transfected with hclA, whole-cell patch clamped at −60 mV. HA was applied using a 10-channel parallel-flow drug delivery system (Skingsley et al., 1995) at the concentrations indicated. B, Simple Hill fittings for data from cells transfected with hclA (circles), hclB (triangles), or both (diamonds). C, Composite Hill curve [Hill equation with weighted components for the contributions of different receptor types (Eq. 2)]; fits for data from cotransfected cells (diamonds and solid curve), as well as the individual components of the equation (dashed curves), are shown. Error bars represent ±1 SD.

