Figure 2.
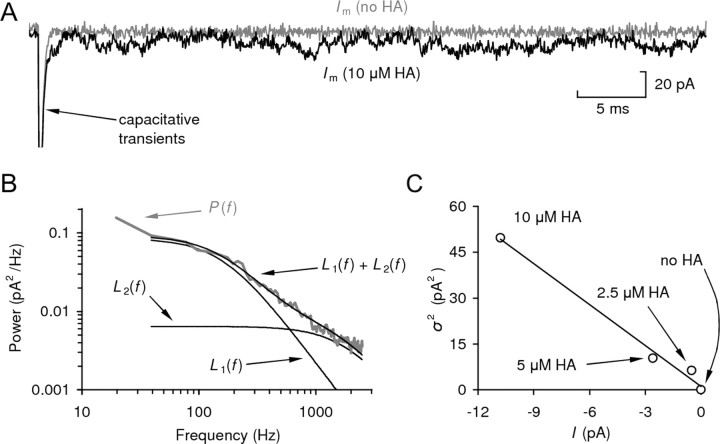
A typical noise analysis experiment. A, Whole-cell patch-clamp recording from an S2 cell transfected with hclA, held at −80 mV. Current was recorded in the presence (10 μm) and absence of HA. The capacitative transients generated by a +10 mV pulse were used to determine the clamp time constant, τRC (180 μs). B, Power spectrum (P) for channel noise at 10 μm HA, fitted with a double Lorentzian function. The component Lorentzian curves, L1 and L2, are also plotted (time constants, τ1 = 0.08 ± 0.01 ms and τ2 = 0.98 ± 0.03 ms, with normalized weights w1 = 0.07 ± 0.01 and w2 = 0.93 ± 0.01). The correction factor to compensate the variance was calculated to be 1.71. C, Plot of macroscopic current variance (σ2) against control-subtracted average current (I) at three different HA concentrations and without HA. The slope of the linear regression, hence single-channel current, was −4.47 pA (R2 = 0.99), indicating a single-channel conductance (γ) of 55.9 pS (at −80 mV).

