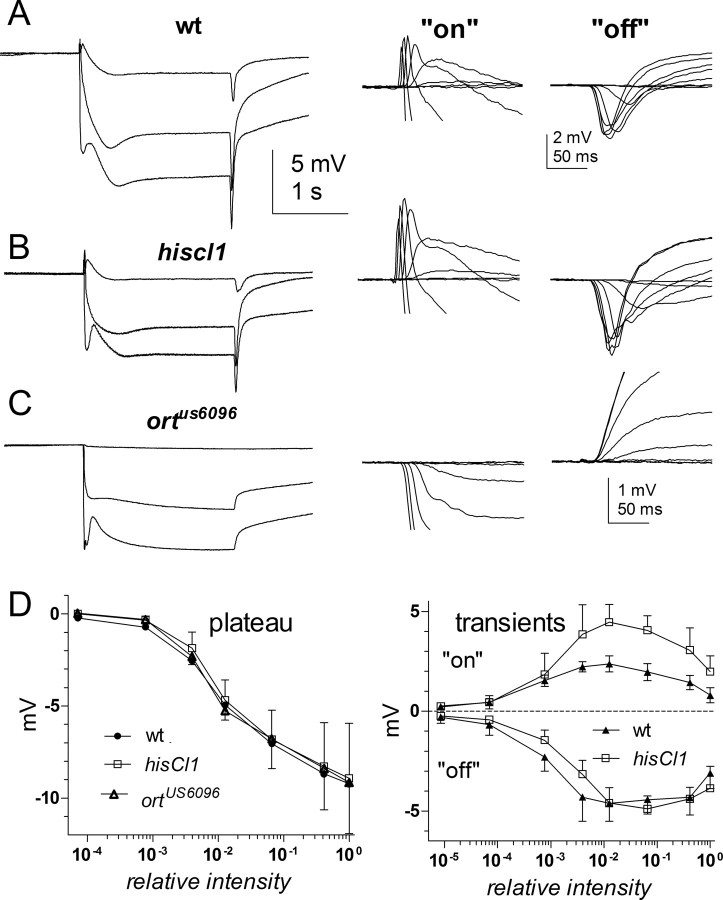
Figure 4.
ERGs from hclA (ort) and hclB (hisCl1) mutants. A, ERGs recorded in response to 2 s light steps of increasing intensity in wild-type (wt; i. e., w1118) control flies. The conspicuous transients at light on and off represent the contribution of the LMCs in the lamina. B, C, ERGs recorded using identical stimulation in a null hclB mutant (w1118;;hisCl1134; B) and a null hclA mutant (w1118;;ortUS6096; C). Examples of “on” (left) and “off” (right) transients in response to increasing intensities (7 steps covering 6 log units of intensity) are shown on the right on an expanded scale after aligning baselines immediately before light on or off. Transients were completely eliminated in ort null (note larger scale). Transients in hisCl1134 were qualitatively similar in waveform to wild-type controls, but the “on” transients were approximately twofold larger. D, Response intensity functions for the maintained negative plateau (photoreceptor component) in wild type (wt; w1118), ortUS6096, and hisCl1134 (left); and both “on” and “off” transients in wt and hisCl1134 (right). Data (mean ± SD) are based on ERGs from n = 5–6 flies for each genotype.

