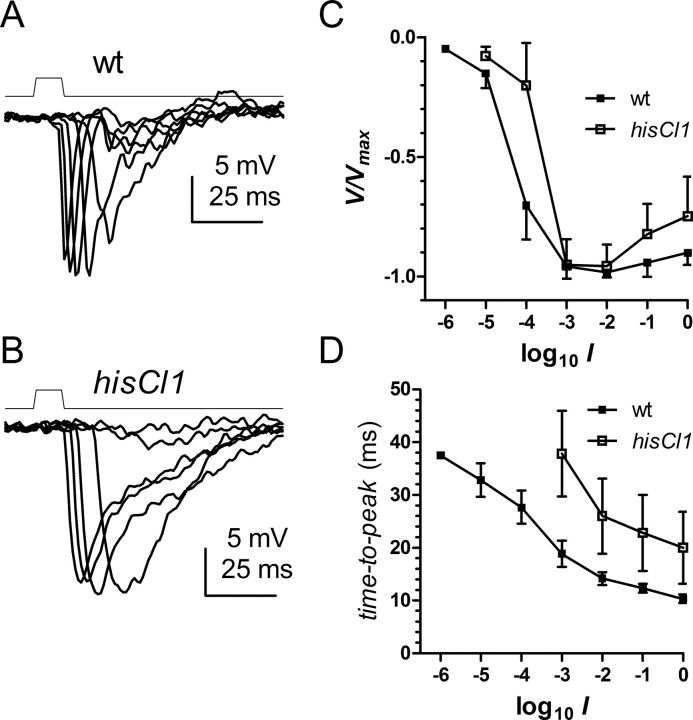
Figure 5.
Intracellular LMC recordings from wild-type (wt; w1118) and hclB (hisCl1134) mutants. A, B, Responses to brief (10 ms) flashes of increasing intensity (log10 steps) in wild-type (w1118; A) and w1118;;hisCl1134 mutants (B). C, Averaged, normalized response intensity (V/log I) functions in wild-type (w1118) and w1118;;hisCl1134 mutants. D, Averaged time to peak at different intensities (mean ± SD; n = 6 cells).

