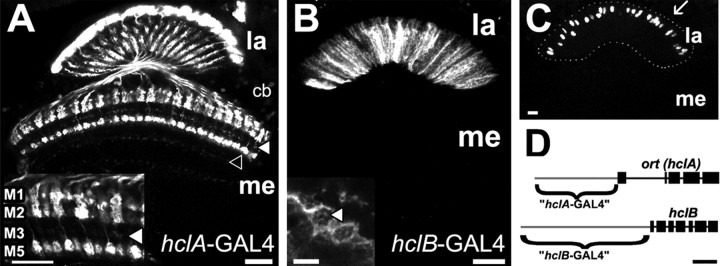
Figure 6.
Enhancer analysis of the two histamine receptor genes. A, ort (hclA)-GAL4-driven expression of GFP. The reporter was detected in lamina (la) monopolar cells L1–L3 (see also inset) and medulla (me) cells (indicated by open arrowhead). cb, Cell bodies. The L3 terminal layer is indicated by a filled arrowhead. The inset shows a 40× magnification of the distal medulla. Layers M1, M2, M3, and M5 were immunopositive, corresponding to the specializations of L1 (M1 and M5), as well as the terminals of L2 (M2) and L3 (M3, indicated by filled arrowhead). Scale bars, 20 μm. B, hclB-GAL4-driven GFP expression. Intrinsic cells in the lamina, but not the monopolar cells, were labeled by this line (compare with A). Scale bar, 20 μm. Inset, Cartridge cross sections reveal that the fibers are epithelial glia that surround the neuroommatidia. Note that the axon terminals of R1–R6 are also not stained (one indicated by arrowhead). Scale bar, 5 μm. C, The same driver as in B combined with a nuclear-localized lacZ reporter. The cell bodies of the immunopositive epithelial glia are within the lamina neuropil (outline indicated by dots), not in the cell body layer, which is located more distally (arrow). Scale bar, 20 μm. D, Schematic of the genomic structure of the two histamine receptor genes hclA and hclB. Light gray lines indicate enhancer regions that were used for expression of GAL4. Scale bar, 1 kb.

