
Figure 1.
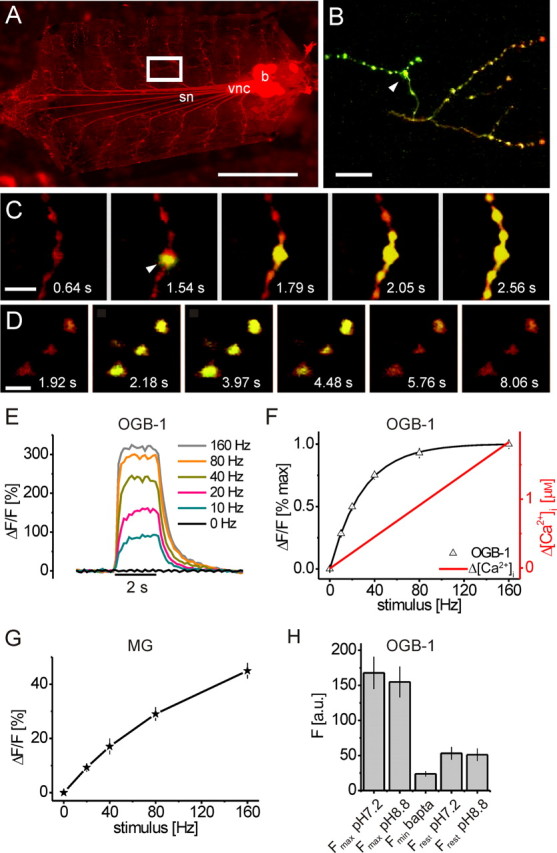
In vivo cross-calibration of OGB-1 fluorescence changes, neural activity, and Δ[Ca2+]i. A, A transgenic Drosophila larva expressing monomeric DsRed (elavC155-gal4→UAS-mDsRed) in all neurons has been prepared for recording. For imaging experiments, the brain was removed and severed nerve ends were placed into a suction electrode for electrical stimulation. OGB-1 was injected into presynaptic boutons using sharp electrodes (white box in A, close-up in B–D) and 2PLSM imaging [image: incident fluorescence light microscopy; brain (b), vnc, segmental nerves (sn)]. B–D, 2P excitation and graphic overlay of simultaneously recorded mDsRed (red) and OGB-1 (green) fluorescence. B, One minute after injection of the synthetic calcium indicator OGB-1 (green), intense green fluorescence is visible near the injection site (white arrowhead). C, Zoom-in during the 2PLSM-controlled injection of OGB-1 into a single bouton (white arrowhead): rapid filling and initial diffusion of OGB-1 along the axonal branch is visible (electrode barely visible). D, Fluorescence changes of OGB-1 (raw data) in response to a train of APs. Time points of frames are indicated; stimulation: 80 Hz from t = 2 to t = 4 s. E, ΔF/F of OGB-1 in boutons evoked by trains of APs at different frequencies plotted as a function of time (fAP = 0–160 Hz; n = 17, 30, 32, 32, 31, and 30 boutons). F, Cross-calibration of OGB-1 fluorescence changes (black triangles, extracted from the data in E; black line represents a hyperbolic fit) to neural activity (fAP) and Δ[Ca2+]i (red trace) in situ. ΔF/F and Δ[Ca2+]i are plotted as a function of fAP. OGB-1 exhibited fluorescence saturation at 160 Hz stimulation, and Δ[Ca2+]i increased linearly up to 160 Hz. Determination of Fmax and Fmin (see H) allowed conversion of the fluorescence changes into an estimate of changes in [Ca2+]i. G, Calcium influx increases approximately linearly with the frequency of action potentials in presynaptic boutons. Steady-state amplitude and SNR of fractional fluorescence changes are plotted as a function of stimulus frequency. Magnesium Green (MG) responses increased almost linearly with stimulus intensity (15 < n < 24). H, Determination of Fmax and Fmin of OGB-1 in situ. Fmax was reached at 160 Hz stimulation; there was no further increase when raising the extracellular pH from 7.2 to 8.8 (p ∼ 0.5; n = 11). Fmin was reached in HL6 with zero [Ca2+] by buffering of [Ca2+]i by excess BAPTA-AM, which reduced the resting fluorescence Frest to Fmin (FminBAPTA vs Frest pH7.2, p < 0.01; n = 11). Frest was unaffected by the extracellular pH (Frest pH7.2 vs Frest pH8.8, p ∼ 0.5; n = 11). Imaging frame rate was 8 Hz throughout. Scale bars: A, 1 mm; B, 20 μm; C, 10 μm; D, 5 μm. Calibration: E, 2 s.