
Figure 2.
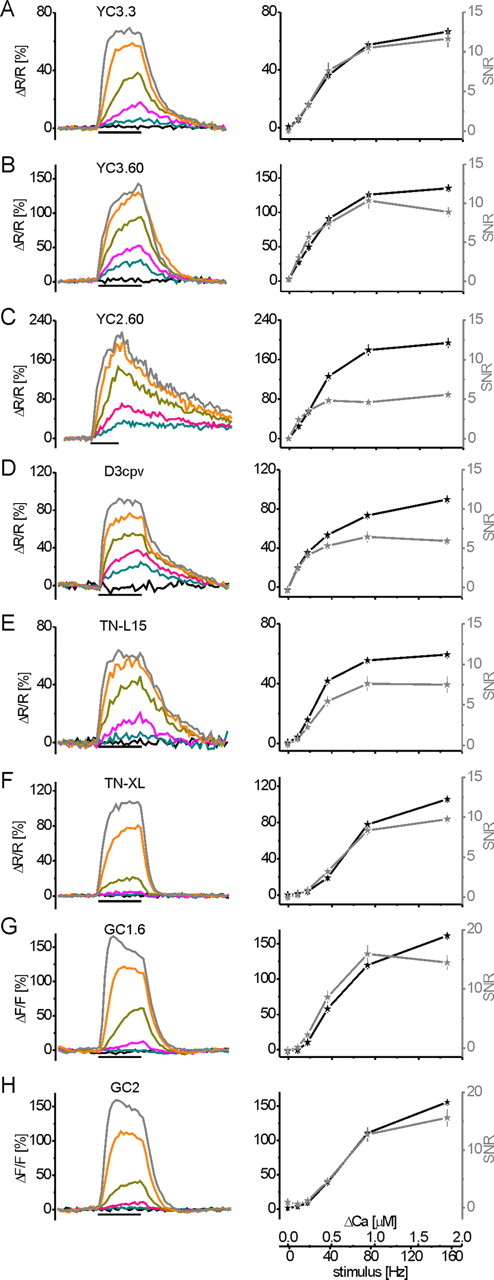
GECI fluorescence changes at sustained neural activity and Δ[Ca2+]i. Transgenic flies were engineered to allow the expression of eight different GECIs in vivo. Fluorescence changes were analyzed at presynaptic terminals of the larval NMJ, similar to the experiment in Figure 1 [2 s stimulus period indicated by the black bar underneath the recording traces; fAP = 0 (black), 10 (blue), 20 (purple), 40 (green), 80 (orange), and 160 (gray) Hz]. A, YC3.3; B, YC3.60; C, YC2.60; D, D3cpv; E, TN-L15; F, TN-XL; G, GC1.6; H, GC2. To the left, mean fractional fluorescence changes (ΔR/R for all dual-chromophore indicators and ΔF/F for GC1.6 and GC2) of a large number of experiments are plotted as a function of time (for n, see Results). To the right, the maximum fluorescence change (black trace) and SNR (gray trace) calculated at steady state are plotted as a function of the stimulus frequency and the corresponding Δ[Ca2+]i, respectively (for conversion of fluorescence changes to Δ[Ca2+]i via OGB-1, see Fig. 1). Images were recorded at 8 Hz frame rate for 8 s (12 s for YC2.60; note different time scale of stimulus bar).