
Figure 5.
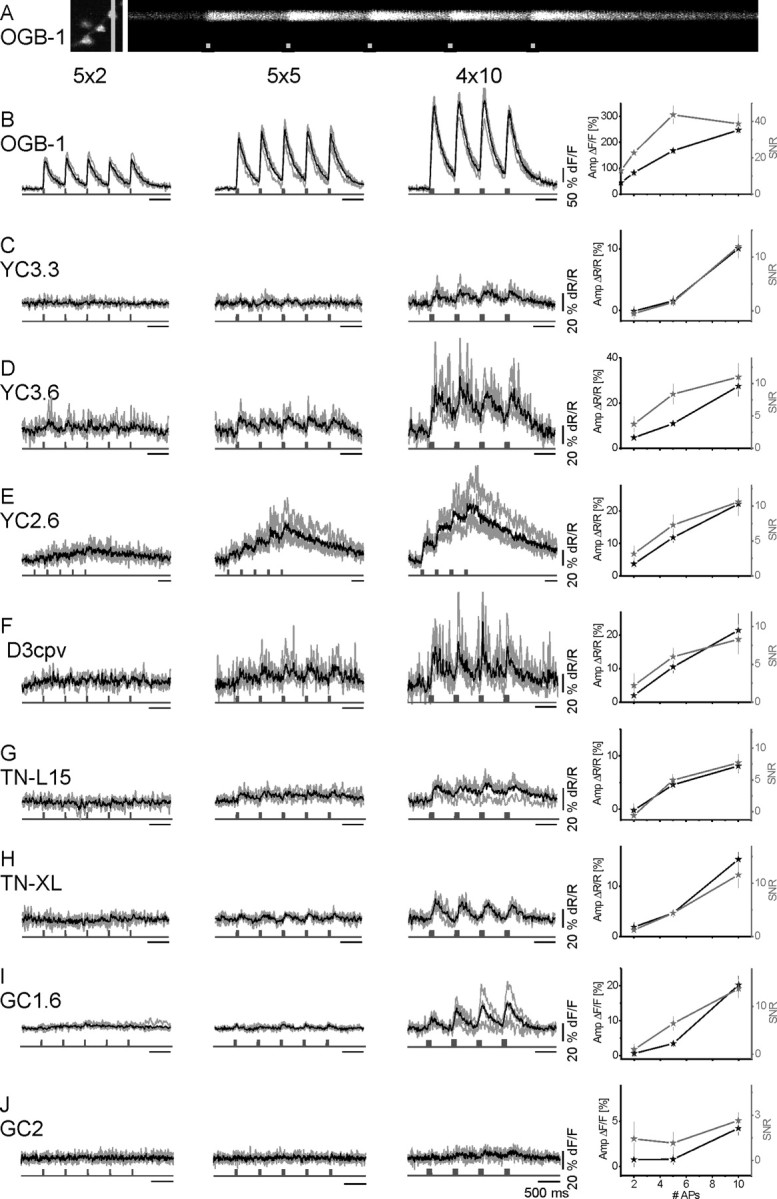
In vivo comparison of fluorescence transients of GECIs and OGB-1 in response to short AP volleys. GECIs and OGB-1 fluorescence changes were recorded in response to biologically more realistic stimuli. Nerves were stimulated with short AP sequences. A, 2PLSM recording in line-scan mode at an acquisition rate of 500 Hz. Left, Close-up of a small branch of a larval NMJ showing several boutons labeled with OGB-1. Position of the line scan is indicated by the light gray line. Right, Raw line-scan data show transient fluorescence increases evoked by calcium influx during AP volleys (light gray squares, 5 APs at 100 Hz/volley; x-axis represents time). Calibration, 200 ms. B–J, OGB-1 (B) and GECI (C–J) recording traces. AP volleys were spaced by 500 ms. Within a volley, APs were elicited at 100 Hz in packs of 2, 5, and 10 APs per volley (first, second, and third columns, respectively). Shown are four individual recording traces from different boutons (gray) and their mean (black). The maximum amplitude of the mean fluorescence response is plotted against the number of APs per volley (mean ± SEM). In addition, the average SNR of single responses to single AP volleys is plotted. Only OGB-1 reliably reported single APs (SNR of >15; see B and supplemental Fig. 3A, supplemental Table 1, available at www.jneurosci.org as supplemental material).