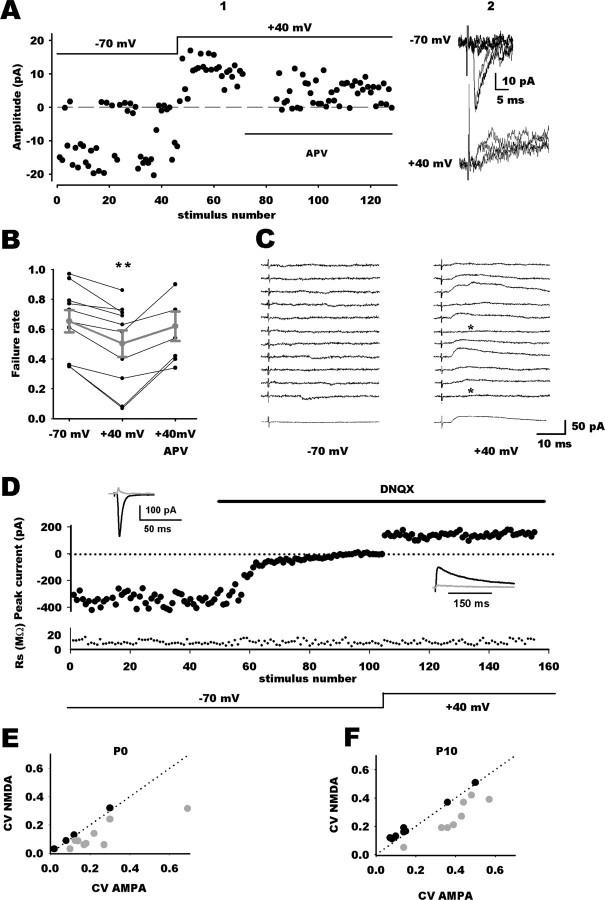
Figure 1.
Silent inputs in the developing NTS. A1, Individual response amplitudes recorded at −70 and +40 mV holding potentials as a function of the stimulus number. Dashed line indicates the mean noise level. At −70 mV, responses are a mixture of successes and failures of synaptic transmission. Depolarization reduced the failure rate. Addition of APV, an NMDAR antagonist, restored failure rate to control values. A2, Superimposed individual traces from the experiment shown in A1 at −70 mV and +40 mV holding potentials. B, Summary graph of minimal stimulation experiments at P0 showing the different failure rate at hyperpolarized (n = 10) and depolarized (n = 10) membrane potentials and in the presence of APV (n = 6). Gray traces are mean values ± SEM. C, Example of a silent synapse at P0 showing exclusively NMDAR-mediated transmission. Right column, At +40 mV, TS stimulation did not induce synaptic response (bottom trace is the average of 40 traces, indicating that synaptic responses were undetectable because of a low signal-to-noise ratio). Left column, At −70 mV, TS stimulation revealed pure NMDA responses. Failures are indicated by asterisks, bottom trace is the average of 40 traces. D, Comparison of EPSC variance mediated by AMPARs and NMDARs. EPSC amplitudes are plotted against stimulus number, with holding potential and application of DNQX indicated schematically. Access resistance magnitude (Rs) is plotted against stimulus number. Top black traces represent average traces in the different conditions, and the gray traces are SDs. E, F, Plots of CVAMPA against CVNMDA at P0 (E) or P10 (F). The dotted lines are the identity lines. In both graphs, gray circles represent values for group 1 neurons (CVAMPA > CVNMDA) and black circles for group 2 neurons (CVAMPA ≤ CVNMDA).

