Figure 6.
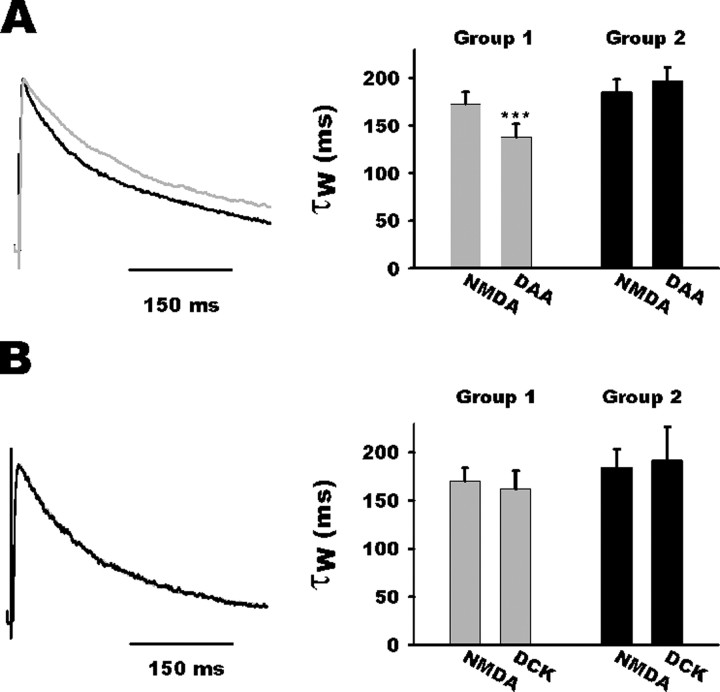
Competitive NMDA antagonist selectively speeds up NMDA EPSC deactivation kinetic. A, Left, Normalized average traces of NMDA EPSC before (gray trace) and after d-AA (DAA; black trace) application for a group 1 neuron. Note acceleration of the decay during d-AA application. Right, Bar histogram summarizing d-AA effect on NMDA current kinetics in both groups. Note that d-AA accelerated NMDA current decay in group 1 neurons (gray bars) but not in group 2 neurons (black bars). B, Left, Normalized average traces of NMDA EPSC before (gray trace) and after (black trace) DCK application. Note the unaltered kinetics during DCK application. Right, Bar histogram summarizing the absence of DCK effect on NMDA current kinetics in both groups.

