
Figure 5.
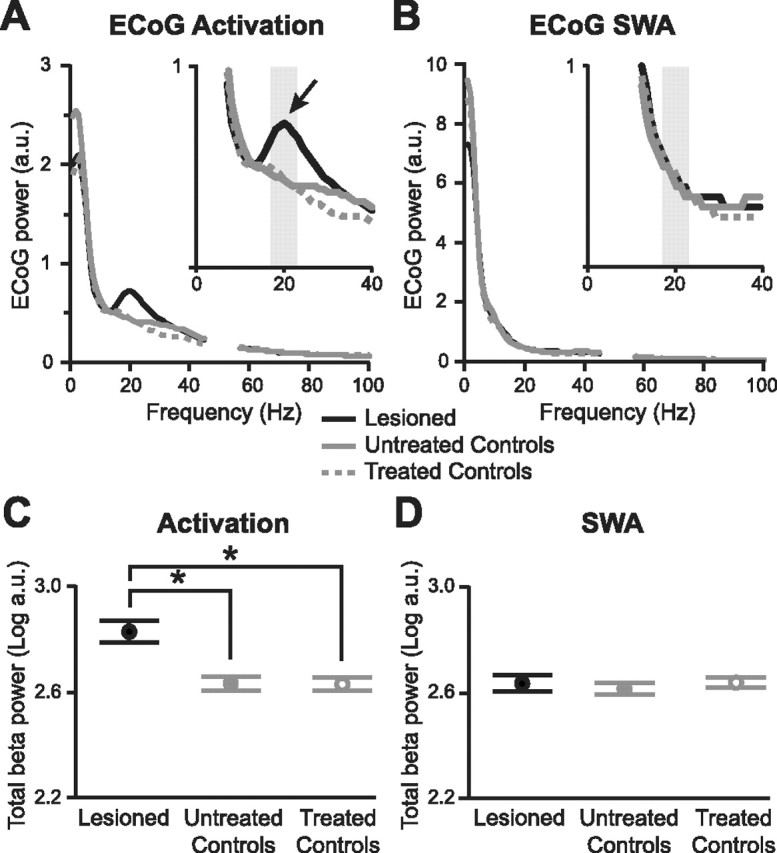
Chronic 6-OHDA lesions, but not acute antagonist treatment, exaggerate beta oscillations in the cerebral cortex. A, Average power spectra of ECoGs recorded in untreated control animals (n = 8), controls after acute antagonist treatment (n = 8, “treated controls”), and chronically lesioned animals (n = 9) during the activated brain state. The gray boxes indicate the peak beta band (17–23 Hz) used in quantitative analyses in C and D. Spectral power at ∼50 Hz (line noise) was removed for clarity. a.u., Arbitrary units. B, Average power spectra of ECoGs recorded in same animals during slow-wave activity. C, D, Average log power of peak beta oscillations (17–23 Hz) in ECoGs across experimental groups and brain states. The power values in A and B were normalized by logarithmic transformation before statistical testing. Data are means ±1 SEM. *p < 0.01. Note the small error bars (SEM) indicating limited variability between beta oscillations in different animals.