
Figure 1.
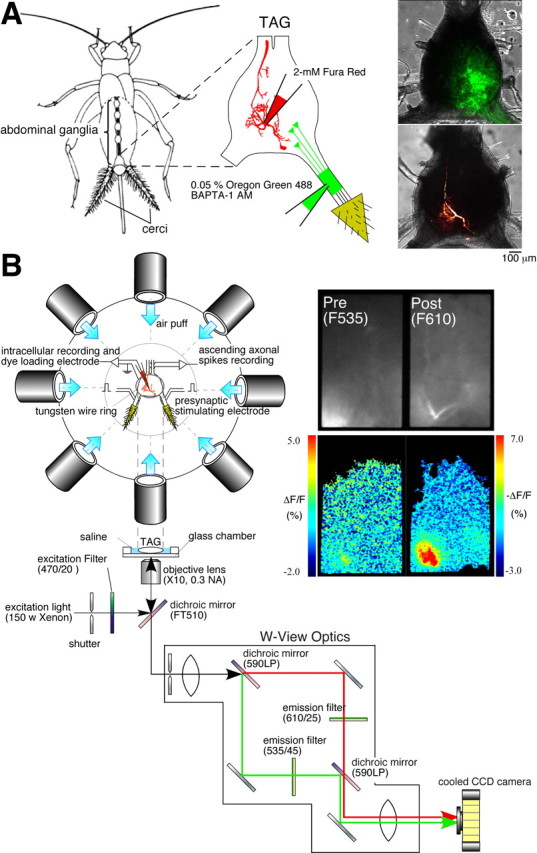
Simultaneous imaging of Ca2+ signals in the axon terminals of receptor afferents and the dendrites of a sensory interneuron. A, Diagrams showing the methods for selective loading of the different Ca2+ dyes. Left, A drawing of the cricket, Acheta domestica, shows the anatomical location of the abdominal ganglia and the connective nerve cord. A solution containing Oregon Green 488 BAPTA-1 AM at a concentration of 0.05% and a dispersing reagent (Pluronic F-127) at a concentration of 1% was pressure-injected through a glass micropipette under the sheath of cercal sensory nerve. Fura Red (2 mm) was iontophoretically injected into the dendritic branch of the cercal sensory interneurons through a glass microelectrode with a hyperpolarizing current of 3 nA for 5–10 min. Right, Superimposed displays of confocal images showing fluorescence of Oregon Green 488 BAPTA-1 loaded into the afferent axons of a left cercus (top image) or Fura Red injected into IN 10-2 (bottom image) over the transmitted light images of the TAG of the cricket. These images were acquired from different samples. B, Diagrams of the experimental setup. The top diagram is an overhead view of the stage for air-current stimulation and electrophysiological recording. The bottom diagram indicates the optical splitting system for simultaneous monitoring of two fluorescent wavelengths of Oregon Green and Fura Red. A fluorescent image was divided into two images by W-view optics with a set of dichroic mirrors and emission filters (see Materials and Methods). Both images were acquired in the same frame, side-by-side with a cooled CCD camera at the same time. Right, Raw fluorescent images (top) prestimulated and pseudocolor images (bottom) indicating the [Ca2+]i elevation in the cercal sensory afferents (left) and IN 10-3 (right) in response to air-current stimulus applied to the cerci from the anterior orientation.