Figure 10.
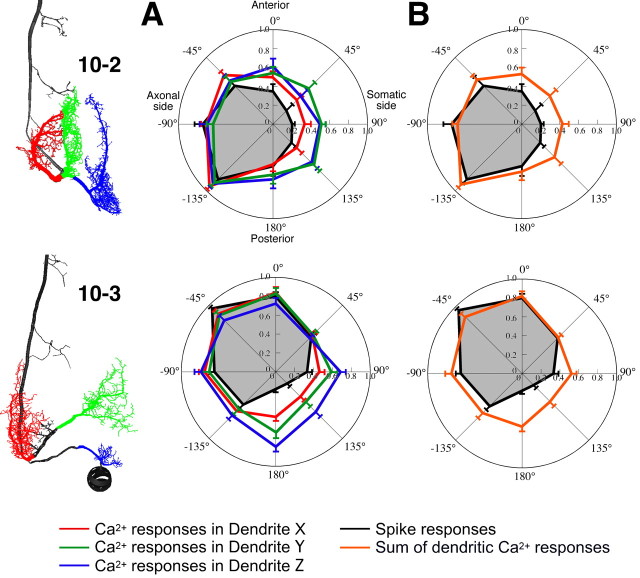
Directional tuning curves of dendritic Ca2+ responses and action-potential responses in the INs. A, Polar plots indicate the mean number of spikes (black line) and the mean amplitude of Ca2+ increases at three different dendrites, X, Y, and Z (red, green, and blue lines, respectively). The presynaptic and postsynaptic Ca2+ signals were measured in three different dendritic regions, X, Y, and Z, of INs 10-2 (top) or 10-3 (bottom) shown in the left images. Each value of the Ca2+ and action-potential responses was scaled to the maximal responses of each measurement. Error bars represent SEM of the scaled responses in different measurements. The data for the tuning curves were acquired from the same measurements shown in Figures 2 and 4. The tuning curves of dendritic Ca2+ responses in IN 10-2 showed similar directional profiles to each other, whereas in IN 10-3, the tuning curve of dendrite X is more similar to the curve of the spike response than that of the other dendrites. B, Directional tuning curves as measured by spike count (black lines) and the curve (orange lines) predicted by calculating the weighted sum of the tuning curves of the individual dendritic responses based on electrotonic distances. Each value of the dendritic tuning curve for the summation was weighted as a function of normalized value of the attenuation (A) (see Materials and Methods), which is V SIZ (voltage at the SIZ)/V dnd (voltage at the branch point of each dendrite). The attenuations measured at 0 Hz are as follows: 0.56 for dendrite X, 0.47 for dendrite Y, and 0.325 for dendrite Z of IN 10-2; and 0.82 for dendrite X, 0.172 for dendrite Y, and 0.36 for dendrite Z of IN 10-3.

