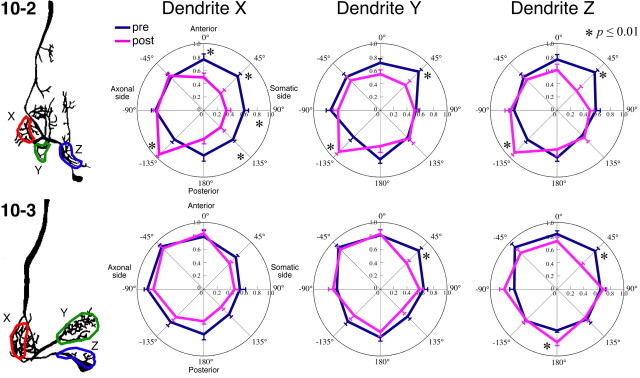
Figure 4.
Directional tuning curves of presynaptic and postsynaptic Ca2+ responses. Polar plots indicate the mean amplitude of the air-current-evoked Ca2+ increases versus stimulus orientation. The presynaptic and postsynaptic Ca2+ signals were measured in three different dendritic regions, X, Y, and Z, of INs 10-2 (top plots) or 10-3 (bottom plots) shown in the left drawings. Each value of the Ca2+ responses was scaled to the maximal responses of each measurement. All points in the plots of IN 10-2 represent the mean value of the scaled responses of 13 measurements in 11 different preparations for presynaptic responses and 11 measurements in 7 different preparations for postsynaptic responses. All points in the plots of IN 10-3 represent the mean value of the scaled responses of 8 measurements in 6 different preparations for presynaptic responses and 12 measurements in 9 different preparations for postsynaptic responses. Error bars represent the SEM of the scaled responses in different measurements. We compared the scaled amplitudes of presynaptic and postsynaptic Ca2+ signals recorded at individual dendrites for each direction using t tests (*p ≤ 0.01). For example, the presynaptic response to stimuli from 0, 45, 90, 135, and −135° directions are significantly different from postsynaptic responses in dendrite X of IN 10-2. However, there is no difference between presynaptic and postsynaptic responses in dendrite X of IN 10-3.

