
Figure 5.
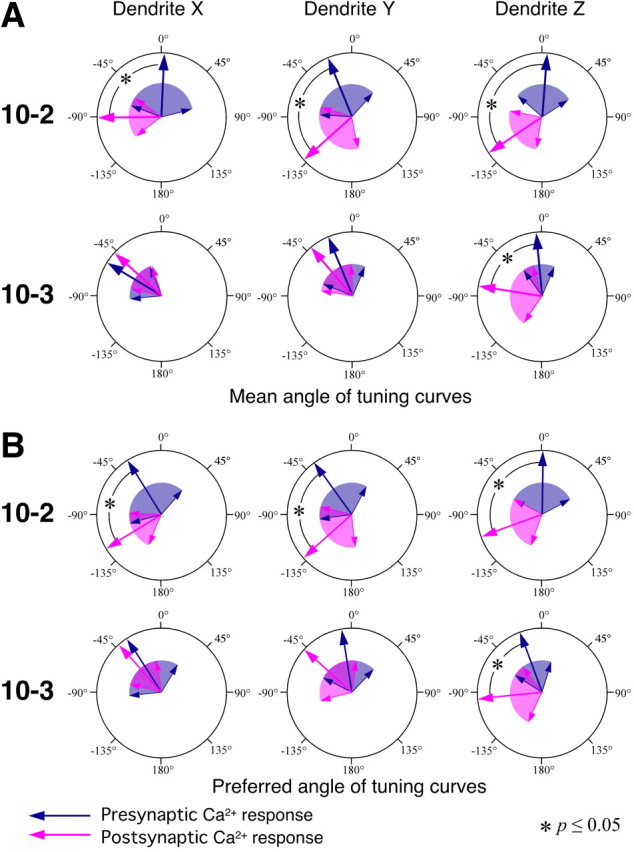
Statistical comparison of the presynaptic and postsynaptic Ca2+ responses of their directional tuning property at each dendrite of INs 10-2 and 10-3. A, B, Large arrows indicate the direction of mean vector of the data on the mean angle (A) or the preferred angle (B) in all samples shown. Colored areas wedged between smaller arrows indicate the angular deviation indicating the range of circular distribution of the data. A, Mean angles representing the directional tuning are show as presynaptic (dark blue arrow) and postsynaptic (magenta arrow) Ca2+ responses. B, Preferred angles from which the stimulus evokes the maximal response in the presynaptic (dark blue arrow) and postsynaptic (magenta arrow) [Ca2+]i changes. Both the mean angle and the preferred angle of directional tuning in the dendritic Ca2+ responses in IN 10-2 are significantly different from those in the presynaptic Ca2+ responses of the sensory afferents arborizing on those dendritic branches (Watson–Williams test, p ≤ 0.05). In the dendrites X and Y of IN 10-3, both angles of the directional tuning in the postsynaptic Ca2+ response are close to those in the presynaptic Ca2+ signals in the region occupied by that dendritic branch (Watson–Williams test, p > 0.05).