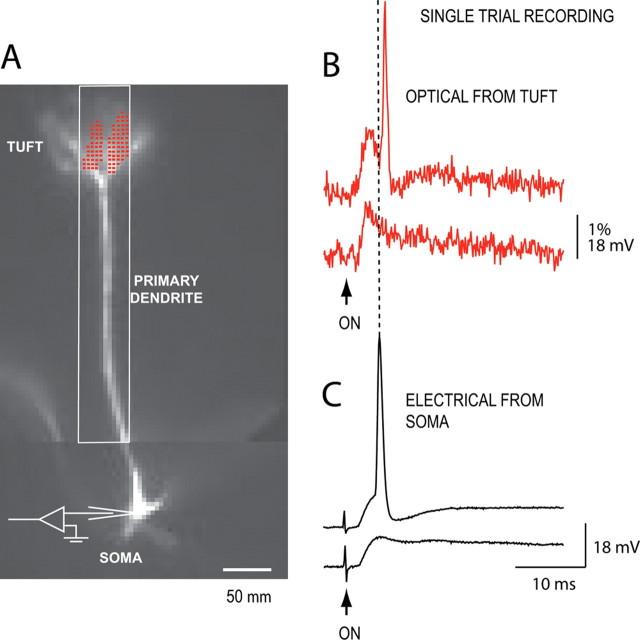
Figure 6.
Simultaneous optical and electrical recordings of the near-threshold EPSP signal and an evoked spike in a mitral cell. A, A composite fluorescence image of a mitral cell. Optical signals are spatial average of pixels marked in red. The white rectangle indicates partial readout area of 12 × 80 pixels sampled at 10 kHz frame rate. B, Optical signal of a subthreshold EPSP (bottom red trace) and a spike evoked by two sequential weak stimuli (top red trace) applied to the olfactory nerve. Optical signals acquired at a frame rate of 10 kHz. Corresponding signals recorded electrically from the soma are shown below (black traces). Note the delay between bAP signals recorded in the soma and in the dendritic tuft, indicating soma–axon initiation site.

