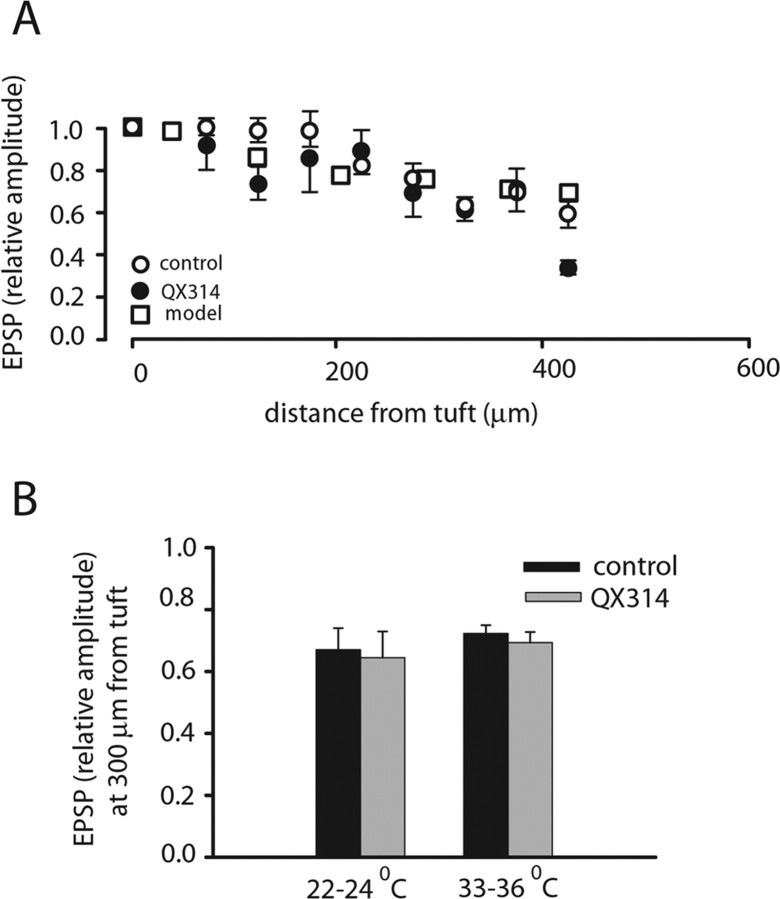
Figure 7.
Attenuation of the EPSP along the primary dendrite. A, Relative EPSP peak amplitude in the primary dendrite as a function of distance from the center of the tuft for control and QX314-treated cells. The prediction from the passive model is included on the same graph. B, Comparison of EPSP attenuation between control and QX314 measurements at 22–24°C and at 33–36°C. Differences are not significant (t test; for control vs QX314 at 22–24°C, p > 0.7; for control vs QX314 at 33–36°C, p > 0.1; for control 22–24°C vs 33–36°C, p > 0.4; for QX314 22–24°C vs 33–36°C, p > 0.8).

