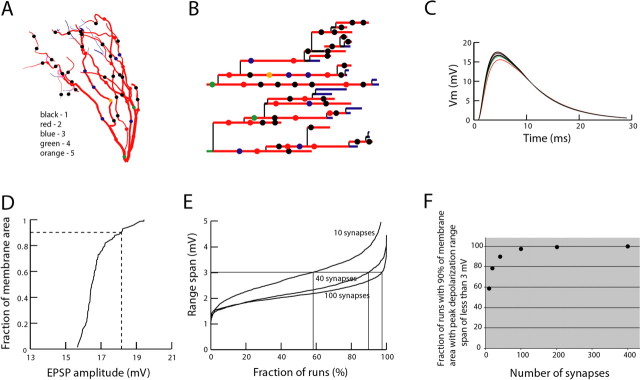
Figure 8.
Modeling of the spatial distribution of EPSP amplitudes in mitral cell glomerular tuft. A, Anatomical reconstruction of a dendritic tuft with random distribution of synapses. B, Location of randomly distributed synapses on the dendrogram of a mitral cell tuft obtained in one simulation run. C, Time course of an EPSP from multiple locations. D, Cumulative membrane area versus EPSP amplitude plot for one simulation run. E, Fraction of runs with 90% of membrane area within a given peak depolarization range span versus peak depolarization range span. F, The percentage of random synaptic distribution patterns with uniform EPSP amplitude distribution versus the number of activated synapses.

