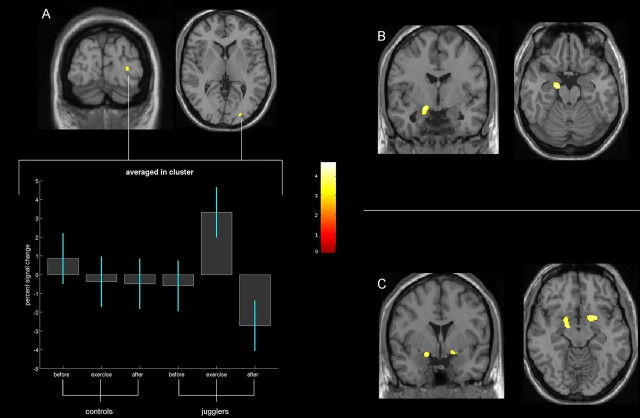
Figure 2.
Time point (before intervention, after intervention) by group (jugglers, controls) interaction analysis, testing for greater changes in the jugglers group. Gray-matter increase is shown superimposed on a normalized T1 image. The left side of the picture is the left side of the brain. A, A significant gray-matter expansion was found in hMT/V5 on the right side. This area is virtually the same area as demonstrated previously (Draganski et al., 2004). The box plot shows relative gray-matter change in the peak voxel in the right hMT for all jugglers over the three time points (error bars indicate the SD, range, and the mean for each time point). B, C, Only the jugglers group, but not the controls, showed a significant gray-matter increase in the hippocampus on the left side (B) and the nucleus accumbens bilaterally (C). This increase of gray matter reversed when study participants were examined at time point 3 (after the weeks without practicing).

