Figure 4.

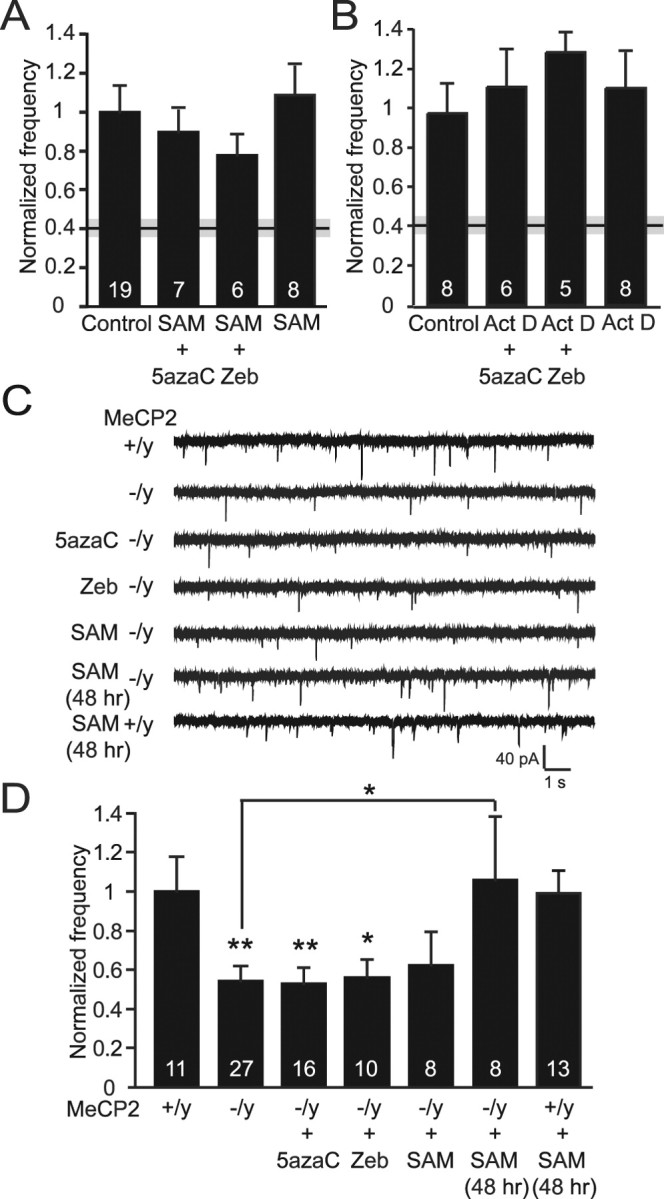
Changes in spontaneous excitatory neurotransmission after DNMT inhibition are mediated by the loss of function of the transcriptional repressor MeCP2. A, Bar graph demonstrating that cotreatment with DNMT inhibitors and the methyl donor, SAM, or treatment with SAM alone, results in no alterations in mEPSC frequency compared with controls. The black and gray bar indicating the mean ± SEM for 5azaC treatment is shown for comparison. B, Bar graph revealing no changes in mEPSC frequencies when neurons were treated with DNMT inhibitors in combination with the inhibitor of transcriptional activation, Act D, suggesting that gene transcription is required for the deficit seen with DNMT inhibitor treatment alone. The black and gray bar indicating the mean ± SEM depicts the 5azaC result. C, Representative traces of mEPSCs recorded from MeCP2-deficient neurons. D, Bar graph showing a significant decrease in mEPSC frequency in MeCP2 knock-out (−/y) neurons compared with wild-type (+/y) littermate controls. A decrease in frequency is also seen after 24 h treatments of knock-out neurons with 5azaC, Zeb, or SAM. However, a 48 h application of SAM onto MeCP2-deficient neurons was able to significantly reverse this frequency deficit compared with control-treated knock-out neurons (**p < 0.01; *p < 0.05). The numbers on the bars indicate the number of experiments (A, B, D).
