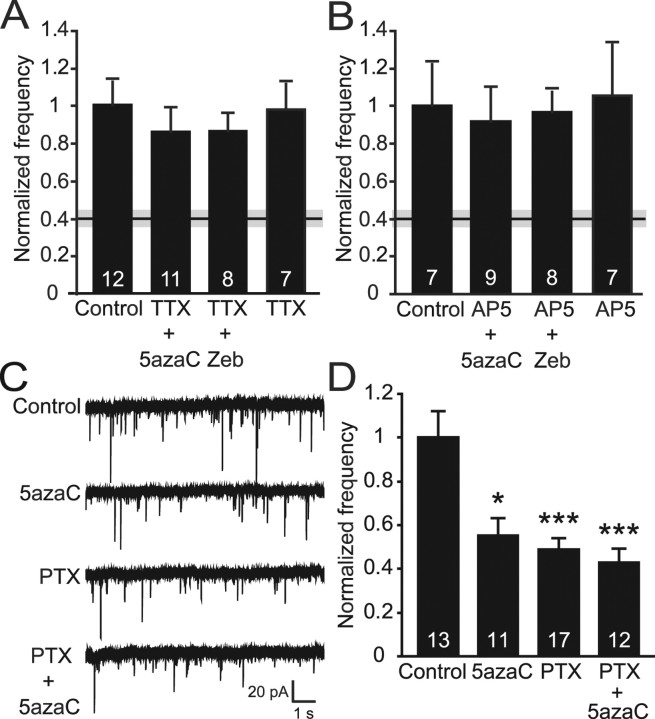
Figure 5.
Treatment of hippocampal cultures with DNMT inhibitors reveals activity-dependent alterations in synaptic transmission. A, Bar graph shows no changes in mEPSC frequency when cultures were treated with DNMT inhibitors in the presence of TTX, suggesting that neuronal activity is required for the decrease in frequency seen with DNMT inhibitor treatment alone (black and gray bar indicates mean ± SEM). B, Bar graph indicates no difference in the frequencies of mEPSCs when 5azaC and Zeb treatments included the NDMA antagonist AP-5. The black and gray bar indicating the mean ± SEM is the result of 5azaC treatment alone. C, Representative traces of mEPSCs recorded after 48 h treatments with PTX and 5azaC. D, Bar graph depicts a decrease in mEPSC frequency after PTX treatment that mimics that seen after treatment with 5azaC. There was no further decrease in mEPSC frequency when the treatments were combined (***p < 0.001; *p < 0.05). The numbers on the bars indicate the number of experiments (A, B, D).

