Figure 8.
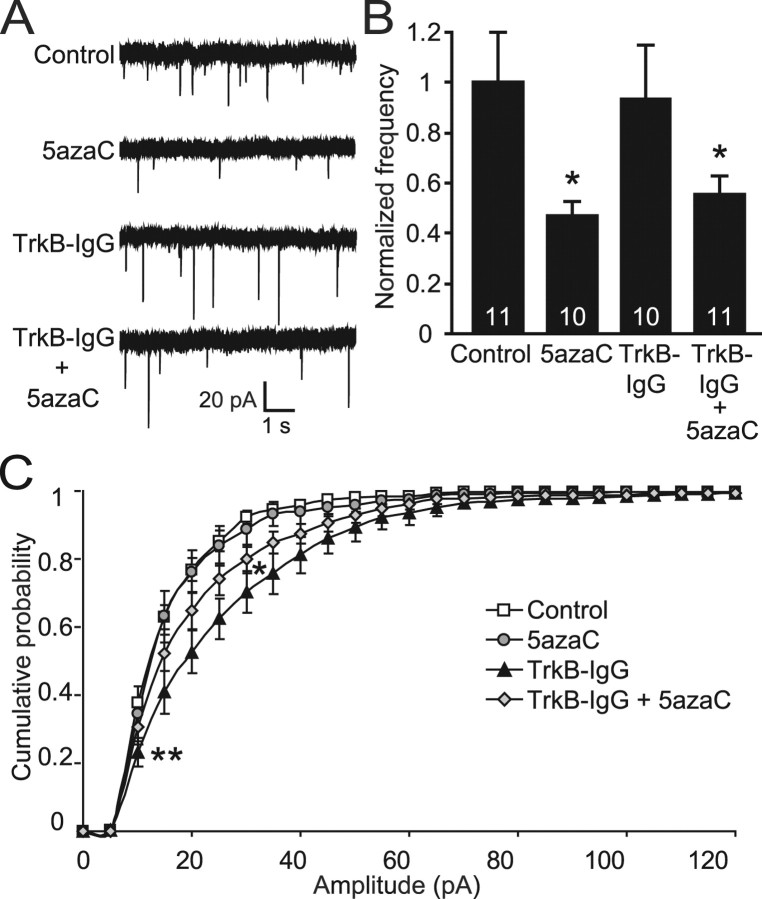
The decrease in mEPSC frequency seen after DNMT inhibition is not mediated by enhanced BDNF signaling. A, Sample traces of mEPSCs recorded from neurons treated with TrkB-IgG antibodies in the presence and absence of DNMT inhibitors. B, Bar graph shows a significant decrease in mEPSC frequency with both 5azaC alone and TrkB-IgG plus 5azaC treatments (*p < 0.05). The number on the bars indicate the number of experiments. C, Cumulative histogram of mEPSC amplitudes reveals a significant increase after TrkB-IgG treatment and a somewhat smaller, but still significant, increase when neurons were exposed to TrkB-IgG in the presence of the DNMT inhibitor 5azaC (*p < 0.05; **p < 0.01).

