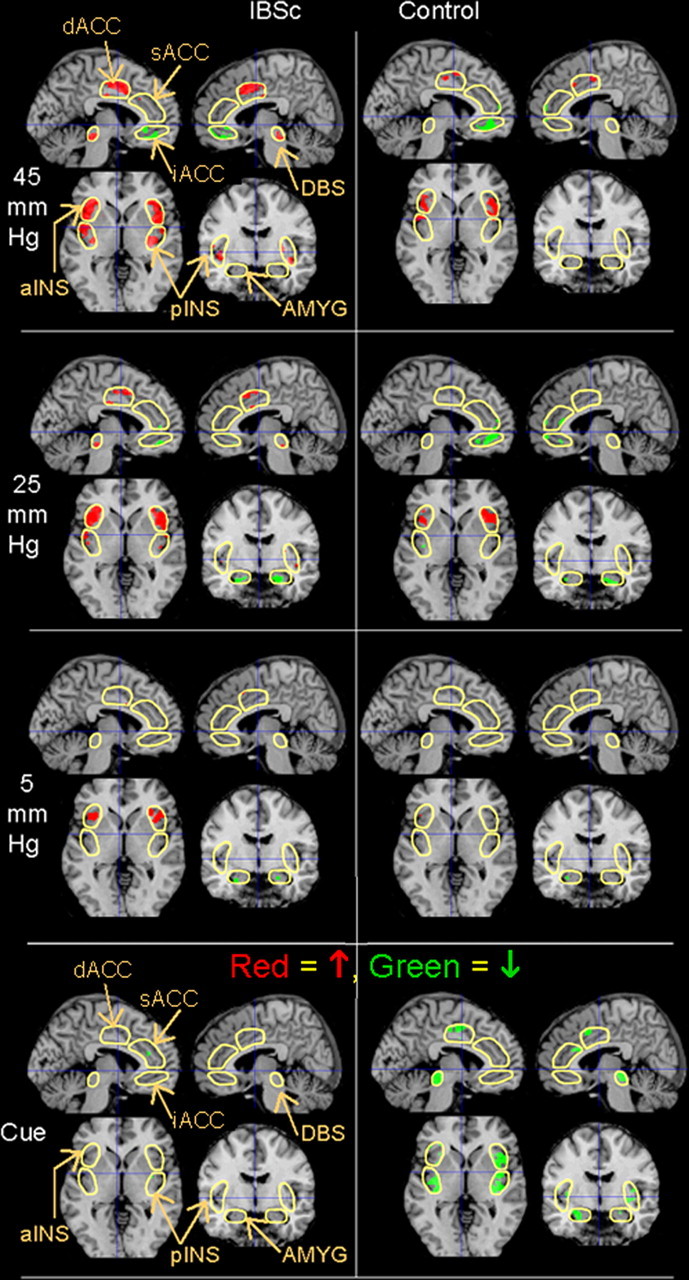
Figure 2.

Group functional activation maps. BOLD responses (p < 0.01) within the ROIs (outlined in yellow) in female IBS-C patients and healthy controls in response to the cue light and the subsequent 5 (sham), 25, and 45 mmHg distentions are superimposed on a structural MRI representative of MNI space for a sagittal slice 5 mm from the midline in each hemisphere (left side, left hemisphere), a coronal slice 6 mm behind the anterior commissure, and a transaxial slice through the anterior commissure. All figures depict neurological orientation (left = left).
