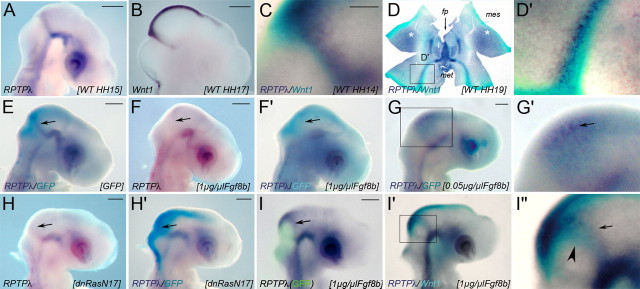
Figure 1.
Expression and regulation of RPTPλ at the MHB. A, Expression of RPTPλ in a WT chick embryo at HH15. B, Expression of Wnt1 at HH17. C, Two-color in situ hybridization showing expression of RPTPλ in dark blue and Wnt1 in turquoise at HH14. The ring of Wnt1 expression at the MHB is bordered by RPTPλ-expressing cells at its rostral side. D, D′, Open book preparation of a HH19 (E3.5) chick midbrain showing RPTPλ expression in dark blue and Wnt1 expression in turquoise. RPTPλ and Wnt1 expression occurs in tightly associated, partially overlapping domains at the MHB; anterior is to the top, and posterior is to the bottom. D′, Higher magnification of the boxed area in D. E–I″, Whole-mount in situ hybridizations on HH15–HH16 chick embryos, electroporated with different expression constructs. In all panels, detected transcripts are indicated in the bottom left corner, and misexpressed transgenes are indicated in brackets in the bottom right corner. E, Expression of RPTPλ (dark blue) was not altered after misexpression of GFP (turquoise; 1.5 μg/μl). F, Transfection of 1 μg/μl of the expression plasmid Fgf8b-pMIWIII together with GFP-pMIWIII effectively repressed RPTPλ expression at the MHB. F′, Two-color in situ hybridization on the embryo shown in F for RPTPλ (dark blue) and GFP (turquoise). G, G′, Transfection of 0.05 μg/μl of Fgf8b-pMIWIII together with GFP-pMIWIII (turquoise) induced RPTPλ expression (dark blue) in the dorsal midbrain. G′ is a higher magnification of the boxed area shown in G. H, RPTPλ expression at the MHB was lost after misexpression of the dominant-negative RasN17 together with GFP. H′, Two-color in situ hybridization on the embryo shown in H (RPTPλ, dark blue; GFP, turquoise). I, Forced expression of Fgf8b (together with GFP) in the MHB region shifted the ring of RPTPλ expression rostrally around the transfected area. The image is an overlay of the GFP fluorescence photographed immediately after harvesting of the embryo and the RPTPλ expression domain as detected subsequently by in situ hybridization (dark blue). I′, I″, Spatial relationship of RPTPλ (purple) and Wnt1 (turquoise) expression in the embryo shown in I. I″ is a higher magnification of the boxed area in I′. In all panels, upregulation of Wnt1 is indicated by arrowheads, and expression of RPTPλ (or lack thereof) is indicated by arrows. The asterisks in D mark upregulation of RPTPλ expression in the mesencephalic alar plate after HH18. C, D, D′, I′, and I″ are false colored for better visual contrast. fp, Floor plate; mes, mesencephalon; met, metencephalon. Scale bars: A, B, E–G, H–I, 500 μm; C, 250 μm.

