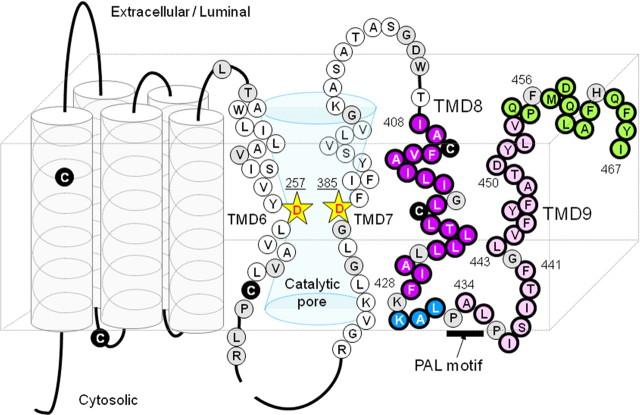
Figure 1.
Locations of the PS1 cysteine mutations used in this study. A schematic depiction of human PS1 based on the nine-TMD topology model is shown. Catalytic aspartates are shown by yellow stars. Endogenous Cys residues that were replaced with serine in Cys-less PS1 are indicated as black circles. Amino acid residues substituted with Cys are shown by a circle with a single-letter character representing the original amino acids. Single-Cys mt was systematically substituted with residues in the predicted hydrophobic region 9, hydrophilic loop, hydrophobic region 10, and the C-terminal region, which are indicated by purple, blue, pink, and green circles, respectively. Cys substitutions that resulted in a loss of γ-secretase activity are indicated as gray circles.

