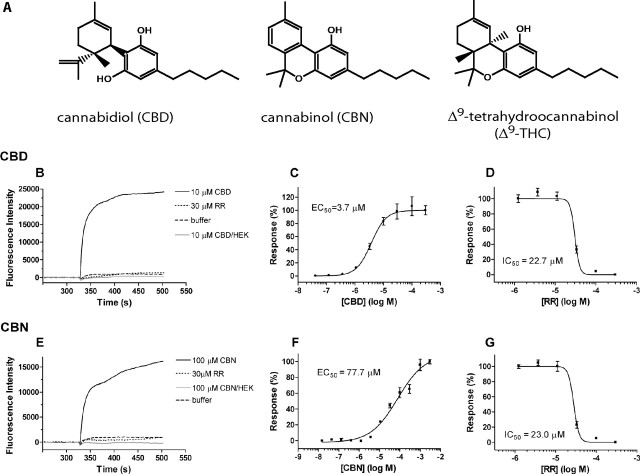
Figure 1.
Activation of rat TRPV2 (rTRPV2) by cannabinoids in calcium mobilization assay. A, Structures of selected cannabinoids. B–G, Representative fluorescence traces of the time course (B, E), concentration–response relationship (C, F), and RR antagonism (D, G) of rTRPV2 activation by 30 μm CBD (B–D) and 100 μm CBN (E–G). In B and E, a robust calcium influx was evoked after addition of CBD or CBN (solid black line); the responses can be completely blocked by 30 μm RR (dotted black line); little fluorescence intensity change was observed in the absence of cannabinoids (dashed black line) or in HEK293 parental cells in the presence of the same concentration of cannabinoids (solid gray line).

