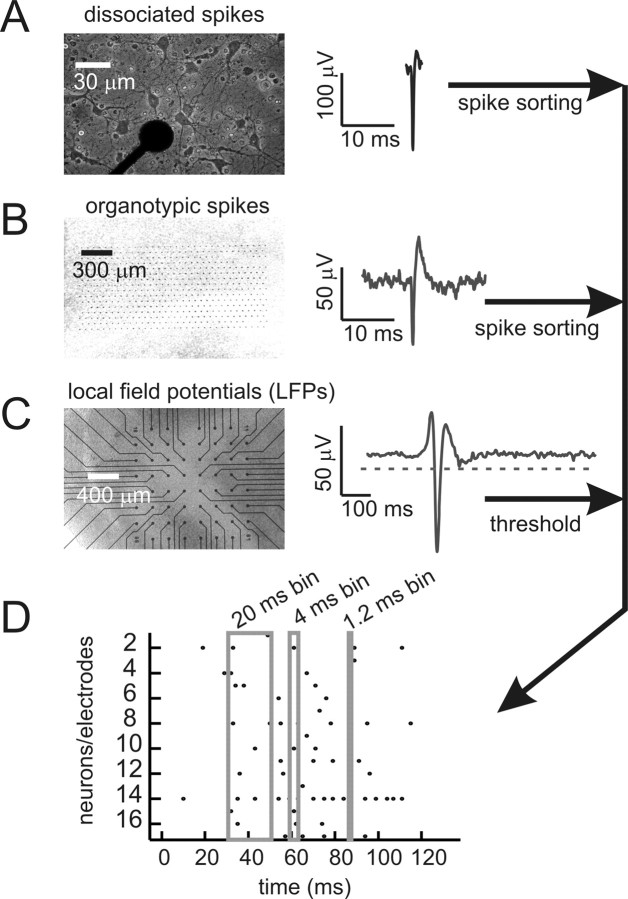
Figure 1.
Data collection and representation. A, Left, Dissociated rat cortical neurons cultured on 60-channel microelectrode array. Several neurons can be seen around an electrode tip, which appears as a black circle. Overall array is similar to the grid shown in C below and has an interelectrode distance of 200 μm. Right, Spike waveform recorded from dissociated culture. Signals that crossed a threshold were cut out and later sorted. B, Left, Organotypic slice culture of rat cortex on high-density array with 60 μm interelectrode distance. Electrodes are visible as small black dots in a hexagonal lattice. Right, Spike waveform from organotypic culture. Full waveform was stored and later sorted. C, Left, Acute slice of human cortex removed from peritumoral region, placed on 60-channel microelectrode array. Right, LFP waveform from acute slice. All signals that crossed a threshold were recorded as events. D, Raster plot of data show gray boxes for the three time bins used: 20, 4, and 1.2 ms. All data were binned at 20 ms, and then also at one finer resolution (4 ms for 200 μm array; 1.2 ms for 60 μm array). Dots represent spikes from individual neurons or LFP negative peaks from individual electrodes. A correlated pattern occurs when events from several neurons/electrodes appear in one time bin.

