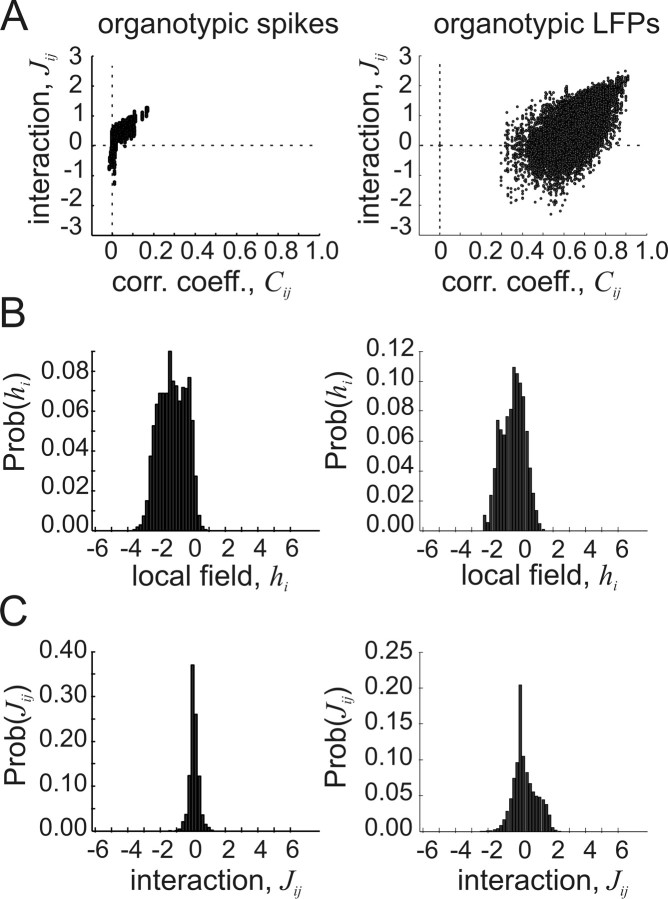
Figure 5.
Interactions and local fields for representative preparations with spikes and with LFPs. A, Left, Interaction strengths Jij plotted against correlation coefficients Cij for spike data from an organotypic culture. Each dot represents one neuron pair from one ensemble; 2500 pairs are shown. Right, Interaction strengths plotted against correlation coefficients for LFPs from an organotypic culture. Note much larger correlation coefficients and wider range of interaction strengths in LFP data. B, Left, Distribution of local field strength hi for organotypic spikes. The distribution mean is negative, indicating that most cells are influenced to not spike by other cells outside the ensemble. Right, Distribution of field strength for organotypic LFPs shows similar negative mean. C, Distribution of interaction strengths for organotypic spikes, left, and for organotypic LFPs, right. Positive and negative interactions exist in both preparations, suggesting that frustration is common (Table 1). Results are shown for data binned at 20 ms.

